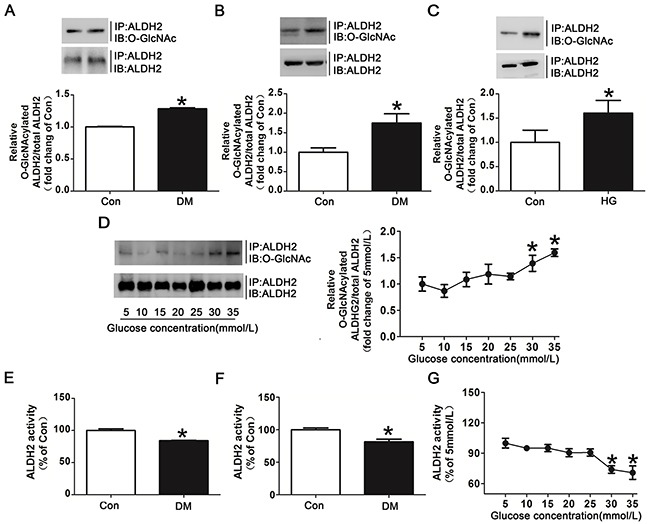
Figure 3. Hyperglycemia increased ALDH2 O-GlcNAc modification and decreased its activity both in vivo and in vitro.

A. ALDH2 O-GlcNAcylation in myocardial tissue of diabetic patients and non-diabetic controls. Tissue lysates were immunoprecipitated with specific anti-ALDH2 antibody and then subjected to western blot using anti-O-GlcNAc (CDT110.6) antibody. B. ALDH2 O-GlcNAcylation in myocardial tissues of diabetic rats and non-diabetic controls. C. ALDH2 O-GlcNAcylation in H9c2 cells treated with high glucose (HG, 30mmol/L) or normal glucose (Con, 5mmol/L) for 48h. D. Dose-dependent effect of glucose on ALDH2 O-GlcNAcylation. The glucose concentrations ranged from 5mmol/L to 35mmol/L. E. ALDH2 dehydrogenase activity in myocardial tissues of diabetic patients and non-diabetic controls. ALDH2 activity was determined by measuring the conversion of NAD+ to NADH. F. ALDH2 dehydrogenase activity in myocardial tissues of diabetic rats and non-diabetic controls. G. Dose-dependent effect of glucose on ALDH2 activity. The glucose concentration ranged from 5mmol/L to 35mmol/L. Mannitol was used to keep the osmolarity consistent among different glucose concentrations in vitro. In each graph, the mean value of Con was expressed as 1 or 100%. IP, immunoprecipitation; IB, immunoblotting. Data are means ± SEM of 4 to 5 samples in each group. *P<0.05 vs Con group or 5mmol/L group.
