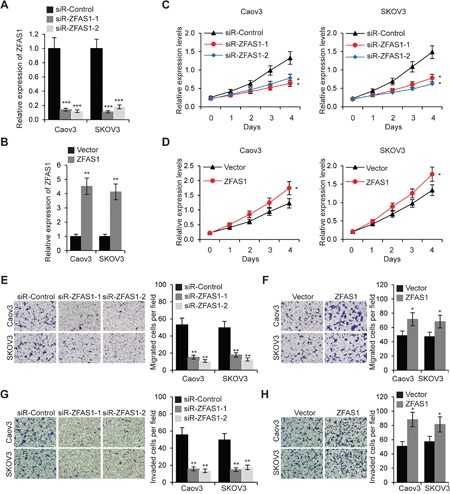
Figure 2. ZFAS1 promotes EOC cell proliferation, migration and invasion.

A. Relative expression levels of ZFAS1 was determined by qRT-PCR in Caov3 and SKOV3 cells transfected with ZFAS1siRNA (siR-ZFAS1-1 and siR-ZFAS1) or control siRNA (siR-Control). B. Relative expression levels of ZFAS1 was determined by qRT-PCR inCaov3 and SKOV3 cells transfected with ZFAS1 overexpression plasmids or empty vector. C. MTT assays of Caov3 and SKOV3 cells transfected with ZFAS1siRNA or siR-Control. D. Caov3 and SKOV3 cells were transfected with ZFAS1 or vector for 48 h, then MTT assays were performed. E. Migration assays in Caov3 and SKOV3 cells transfected with ZFAS1siRNA or control siRNA. F. Caov3 and SKOV3 cells were transfected with ZFAS1 or vector, then cell migration assays were performed. G. Invasion assays in Caov3 and SKOV3 cells transfected with ZFAS1siRNA or control siRNA. H. Caov3 and SKOV3 cells were transfected with ZFAS1 or vector, then cell invasion assays were performed.*p<0.05, **p<0.01 and ***p<0.001 compared with control cells.
