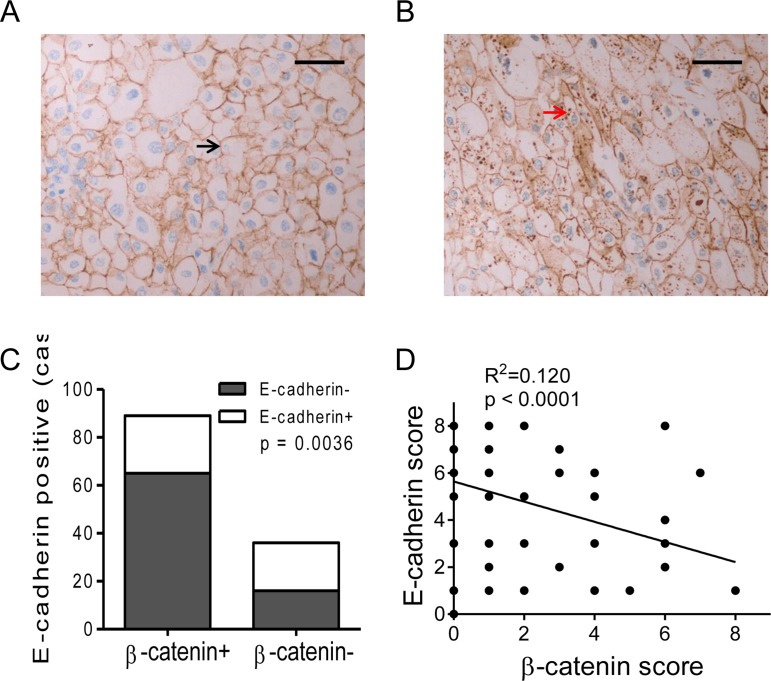
Figure 3. Expression of β-catenin and correlation with E-cadherin in RCC specimens.
(A, B) β-catenin expression images of RCC specimens. Positive β-catenin expression was mainly located on the membrane in E-cadherin positive specimen (A, black arrow), and cytoplasmic accumulation of β-catenin in E-cadherin negative specimen (B, red arrow). Bar, 50 μm. (C) The percentage of E-cadherin+ was compared between β-catenin positive or negative RCCs. (D) Negative correlation of E-cadherin and β-catenin expression scores in RCC specimens according to a linear regression.

