
Figure 3. CAF exosomes promote stemness, epithelial–mesenchymal transition, and anchorage-independent cell growth.
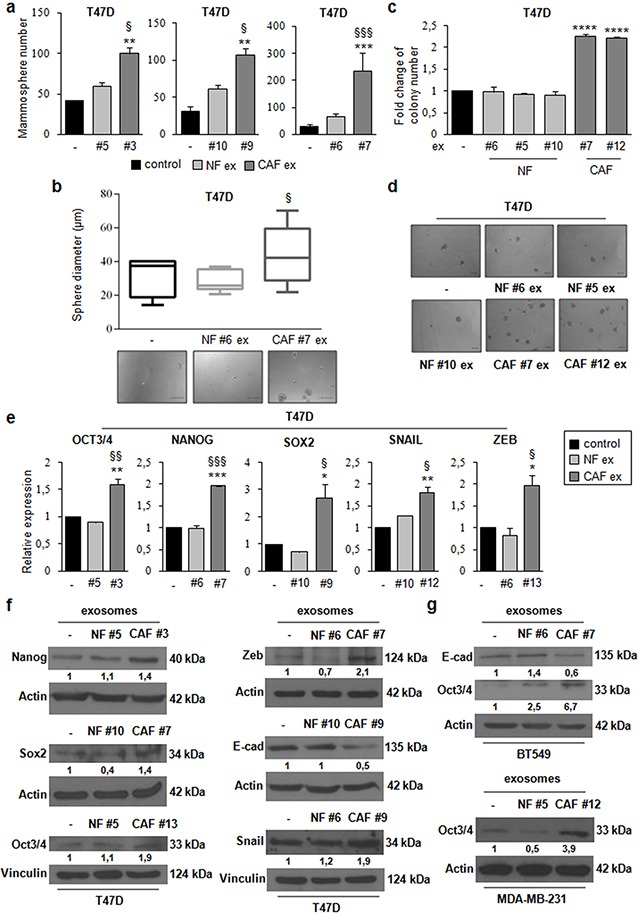
T47D cells were cultured under non-adherent conditions in stem medium in the absence (control) or presence of either NF exosomes (patients #5, #6, and #10) or CAF exosomes (patients #3, #7, and #9). After four days, the capacity of cells to form spheres was assessed a. Sphere diameter distribution (control cells and T47D cells treated with either NF#6 ex or CAF#7 ex) for 10 representative fields. Scale bar: 100μm b. T47D cells were cultured in the absence (control) or presence of either NF exosomes (patients #5, #6, and #10) or CAF exosomes (patients #7, and #12). After 24h, cells were harvested and cultured in soft agar c. Scale bar: 100μm d. T47D cells were cultured in the absence (control) or presence of either NF ex (patients #5, #6, and #10) or CAF ex (patients #3, #7, #9, #12 and #13) for 24h e. or 48h f. Real Time PCR was performed to analyze oct3/4, nanog, sox2, snail and zeb mRNA levels (e). Western blot analysis was performed to evaluate nanog, sox2, oct3/4, zeb, e-cadherin and snail protein levels (f). BT549 cells were cultured in the absence (control) or presence of either NF exosomes (patient #6) or CAF exosomes (patient #7) for 48h. Western blot analysis was performed to evaluate e-cadherin and oct3/4 protein levels. MDA-MB-231 cells were cultured in the absence (control) or presence of either NF exosomes (patient #5) o CAF exosomes (patient #12) for 48h. Western blot analysis was performed to evaluate oct3/4 protein level g. Western blot from representative experiments is shown. Actin or vinculin were used as loading controls. The experiments were repeated at least three times (f, g). In a, b, c, e, data were obtained from three independent experiments and are presented as mean value ± SD. P-value was calculated using one-way ANOVA followed by Bonferroni's post hoc testing. * p<0.05; ** p<0.01; *** p<0,001 (over control); § p<0.05; §§ p<0.01; §§§ p<0,001 (over NF ex) (a, b, e). P-value was calculated using Student's t test. * p<0.05; ** p<0.01; *** p<0.001; **** p<0.0001 (over control) (c).