
Figure 4. miR-21, miR-143, and miR-378e promote stemness and epithelial–mesenchymal transition.
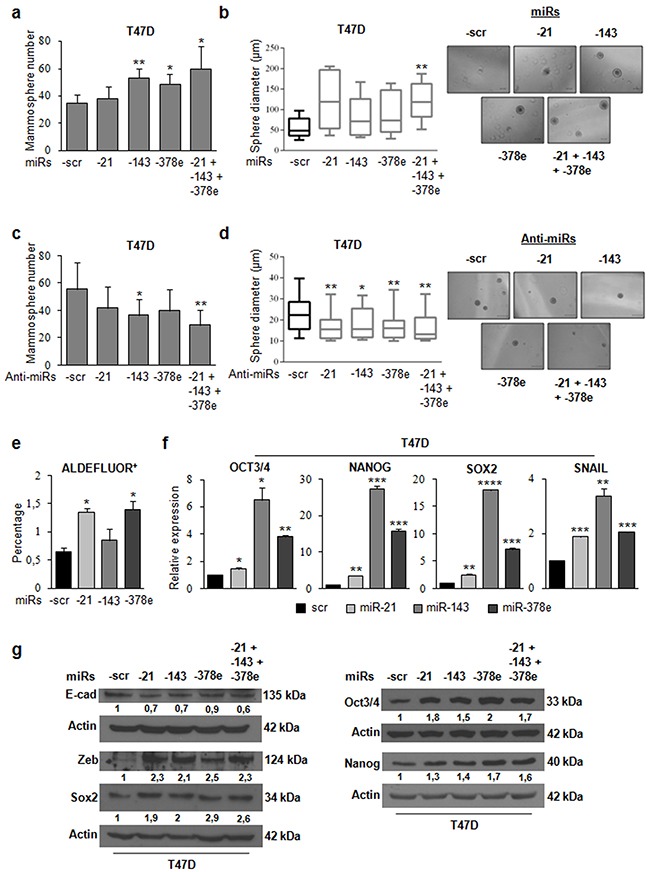
T47D cells were transfected with scrambled (scr, control) or miRs -21, -143, and -378e, alone or in combination (final concentration: 100nM). After 48h, cells were harvested and cultured under non-adherent conditions in stem medium. After four days, the capacity of cells to form spheres was assessed a. Sphere diameter distribution for 10 representative fields. Scale bar: 100μm b. T47D cells were transfected with anti-miRs (alone or in combination, final concentration: 200nM) or scrambled anti-miR (anti-miR-scr, control). After 24h, cells were harvested and cultured under non-adherent conditions in stem medium. After four days, the capacity of cells to form spheres was assessed c. Sphere diameter distribution for 10 representative fields. Scale bar: 50μm d. ALDEFLUOR assays were performed in T47D cells transfected with scrambled or miRs -21, -143, and -378e for 48h e. T47D cells were transfected with scrambled, miRs -21, -143, or -378e for 48h f. or 72h g. Real Time PCR was performed to analyze oct3/4, nanog, sox2, and snail mRNA levels (f). In addition, T47D cells were transfected with the miRs alone or in combination for 72h. Western blot analysis was performed to evaluate nanog, sox2, oct3/4, zeb, and e-cadherin protein levels (g). In a, b, c, d, e, f, data were obtained from three independent experiments and are presented as mean value ± SD. P-value was calculated using Student's t test. * p<0.05; ** p<0.01; *** p<0.001; **** p<0.0001 (over control). Western blot analysis from representative experiments. Actin was used as loading control. The experiments were repeated at least three times (g).