
Figure 5. Effects of miRs-21, -143, and -378e on stemness and EMT markers in triple-negative breast cancer cells.
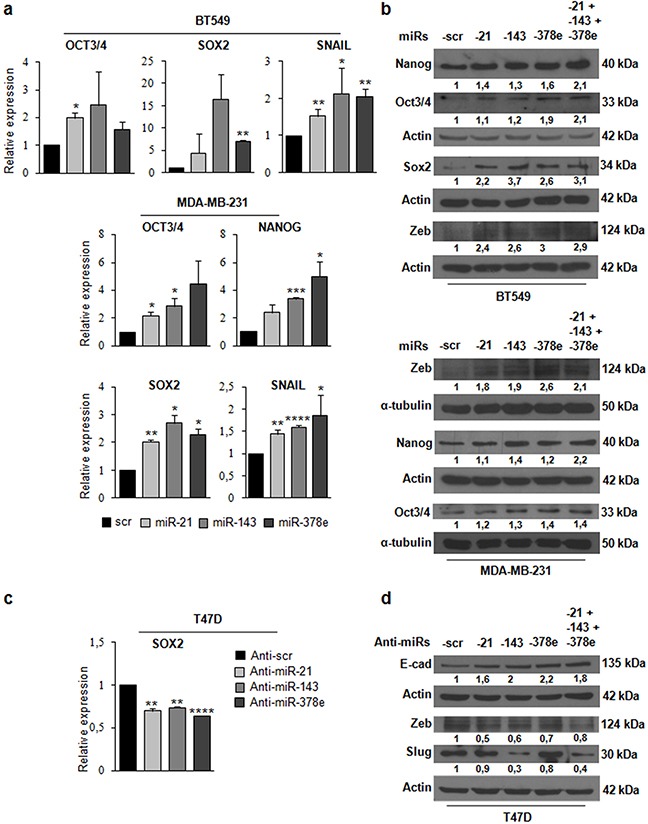
BT549 cells were transfected with miRs: scr, -21, -143, and -378e, for 24h. Real Time PCR was performed to analyze oct3/4, sox2, and snail mRNA levels a. In addition, BT549 cells were transfected with these miRs alone or in combination for 48h. Western blot analysis was performed to evaluate nanog, oct3/4, sox2, and zeb protein levels b. MDA-MB-231 cells were transfected with miRs: scr, -21, -143, and -378e, for 24h. Real Time PCR was performed to analyze oct3/4, nanog, sox2, and snail mRNA levels (a). In addition, MDA-MB-231 cells were transfected with these miRs alone or in combination for 48h. Western blot analysis was performed to evaluate zeb, nanog, and oct3/4 protein levels (b). T47D cells were transfected with anti-miRs: -scr (control), -21, -143, and -378e, for 48h. Real Time PCR was performed to analyze sox2 mRNA levels c. In addition, T47D cells were transfected with anti-miRs (alone or in combination; final concentration: 200nM) for 72h. Western blot analysis was performed to evaluate e-cadherin, zeb, and slug protein levels d. Western blot analysis from representative experiments. Actin or α-tubulin were used as loading controls. The experiments were repeated at least three times (b, d). In a and c, data were obtained from three independent experiments and are presented as mean value ± SD. P-value calculated using Student's t test. * p<0.05; ** p<0.01; *** p<0.001; **** p<0.0001 (over control).