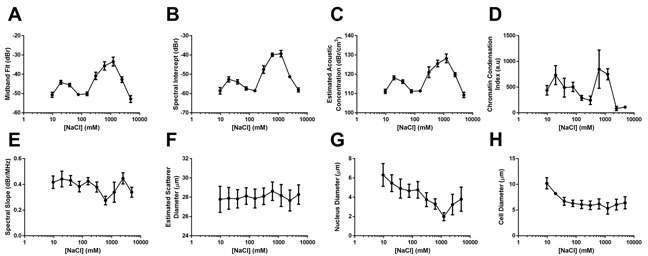
Figure 2. Quantitative data dervied from spectral ultrasound analysis, electron miscropy analysis, and ultrasound form factor analysis.

Results of relative A. mid-band fit, B. spectral intercept, and C. estimated acoustic concentration for whole cells subjected to sodium concentrations from 1/16X salinity to 32X salinity. Observed trends corresponded strongly to an D. index of chromatin condensation based on quantifying the number of 30 nm strands and larger chromatin clusters per high-powered field and multiplying by a scaling factor for clearer data presentation. E. Results from the spectral slope parameter were not signficantly different, corresponding to statistically-similar values for F. estimated scatterer diameter throughout all salinities. G. Measured sizes of nuclear diameter and H. cellular diameter did demonstrate trends of increasing size for lower salt concentrations, but did not appear to affect spectral slope or estimated scatterer diameter. Error bars represent SD at n ≥ 4.
