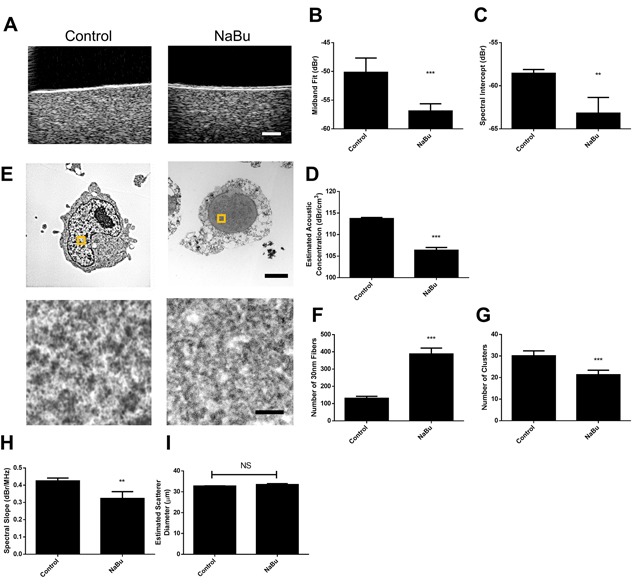
Figure 3. Representative results from sodium butyrate treatment of in vitro samples.

A. B-mode images indicated decreases in ultrasound backscatter, corresponding to decreases in B. midband fit, C. spectral intercept, and D. estimated acoustic concentration. E. Electron microscopy images depict signficant alterations in chromatin structure, indicating a decrease in chromatin compaction. Selected regions of higher maginifcation are represented by squares on lower magnificaion panels. F. Quantified counts of the number of 30 nm strands and G. larger chromatin clusters per high-powered field. H. Spectral slope and I. estimated scatterer diameter measurements demonstrated slight changes as a function of treatment. ** and *** indicate p<0.01 and p<0.001, respectively, for n ≥ 4 samples. The scale bar in B-mode images represents 1 mm. Scale bars for low-magnification and high-magnification electron micrscopy images correspond to 2 βm and 100 nm, respectively.
