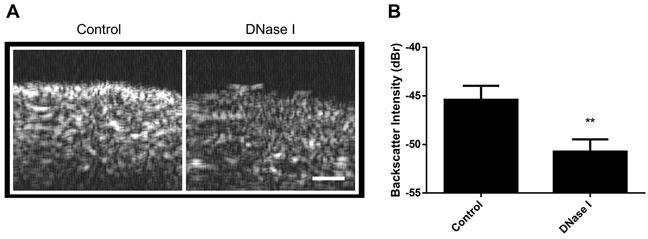
Figure 5. Imaging of DNase I treatment in excised mouse liver.

A. B-mode images of control (left) and 1 hour DNase I- treated samples (right). Darker pixels correspond to lower levels of ultrasound scattering and white representing regions of increased ultrasound scattering levels. B. When quantified to determine backscatter intensity, DNase I treatment results in signficant decreases to sample echogenecity. ** indicates p<0.01 statistical significance for n=4 measurements. Scale bar represents 0.5 mm.
