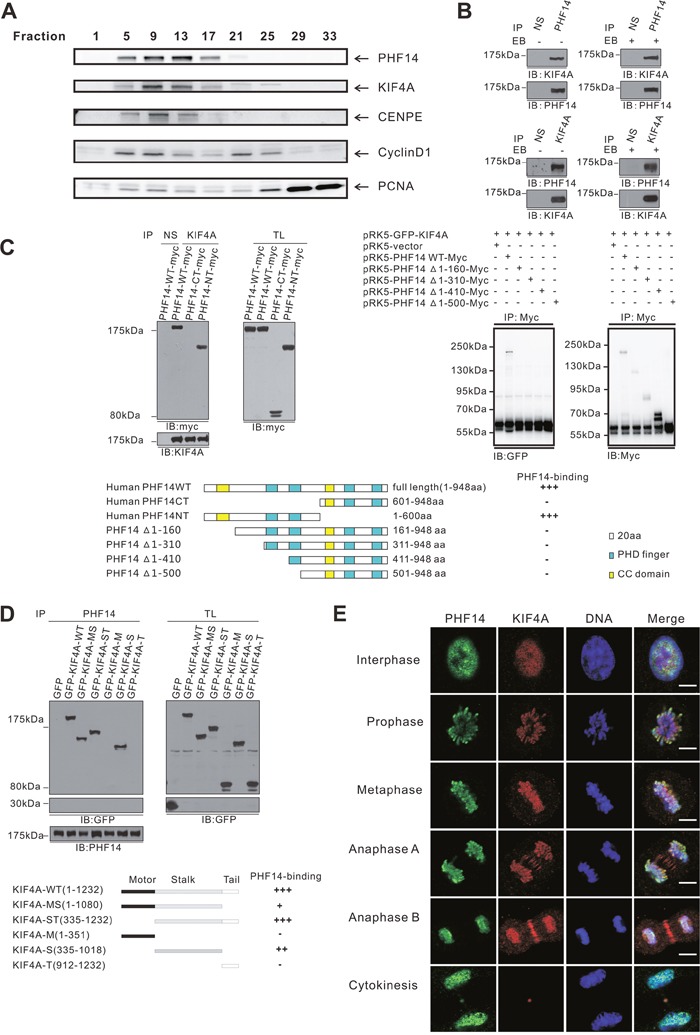
Figure 4. PHF14 and KIF4A formed a physical complex and co-localized extensively in the nucleus during mitosis.

A. FPLC strategy to identify protein complexes in nuclear extract from HeLa cells. PHF14, KIF4A, CENPE, and Cyclin D1 were detected in the same fractionations using western blotting analysis. B. Co-immunoprecipitation of endogenous PHF14 and KIF4A in A549 cells. C. and D. Mapping of the interaction site between PHF14 and KIF4A. Upper panels of (C): co-immunoprecipitation analysis of myc-tagged PHF14 or its mutants with GFP-tagged WT KIF4A. Myc-PHF14 or its mutants and GFP-KIF4A were co-overexpressed in HCT-116 cells. Lower panels of (C): schematic representation of PHF14 mutants. Upper panel of (D): co-immunoprecipitation analysis of GFP-tagged WT KIF4A or deletion mutants with PHF14. GFP-tagged WT KIF4A or deletion mutants were expressed in 293T cells. Lower panel of (D): schematic representation of KIF4Amutants. The affinity of the binding was rated as follows: +++: intensive; ++: moderate; +: weak; -: binding not detectable. E. Co-localization of endogenous PHF14 and KIF4A in A549 cells. A549 cells were stained with anti-PHF14 antibodies (green), anti-KIF4A antibodies (red) and DAPI (DNA, blue). Scale bar = 5 μm.
