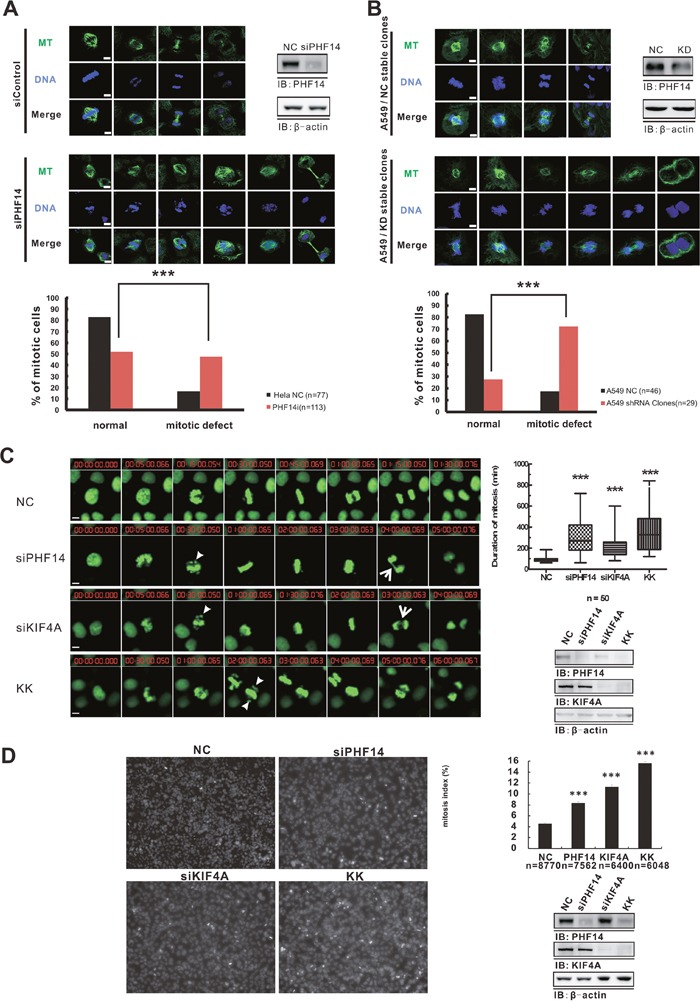
Figure 6. Depletion of PHF14 and KIF4A induced mitotic defects.

Chromosome and spindle morphology defects during mitosis in PHF14-depleted HeLa cells A. and PHF14-depleted A549 cells B. Upper panels: cells were stained with anti-tubulin (green) and DAPI (DNA, blue) to reveal the spindle and the chromosome. Chromosome misalignment, anaphase separation incompletion, and spindle defects of the distinct mitotic cells can be seen in PHF14-depleted cells. Bar, 5μm. Lower panels: statistics of mitotic phenotypes. C. The effect of PHF14 and/or KIF4A depletion on mitosis in HeLa cells. Left panel: representative images from time-lapse movies. HeLa cells stably expressing histone H2B-GFP (green) were transfected with control siRNA (NC), PHF14 siRNA (siPHF14), KIF4A siRNA (siKIF4A) or PHF14/KIF4A siRNA (KK). Bar, 5 μm. Arrowheads indicate mis-aligned chromosomes and arrows indicate incomplete-separated chromosomes inPHF14RNAi and/or KIF4A RNAi cells. Upper right panel: quantitative analysis of the duration of the M phases of HeLa H2B-GFP cells after different siRNA treatments. Data from at least three different experiments are represented as box-and-whisker plots. D. Analysis of mitotic index in HeLa cells. Left panel: representative cell images of HeLa cells transfected with different siRNAs. Random images (9 images, 6,000–8,000 cells) were analyzed per experiment, and mitotic cells were identified in the 405 nm channel on the basis of their condensed DNA content. Upper right panel: the mitotic index was calculated and is presented as the mean ± s.d.; *** P<0.0001. n=number of analyzed cells. Lower right panels: western blot results showing the efficiency of PHF14 and/or KIF4A knockdown in the indicated cells. β-actin was used as the loading control.
