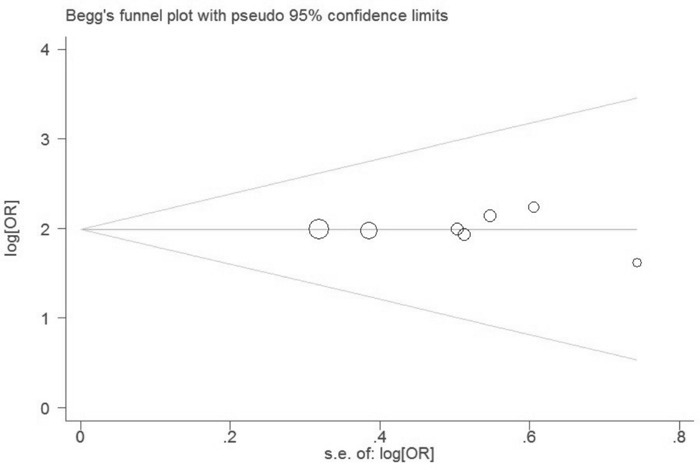
Figure 9. Funnel plot for evaluating publication bias on association between tissue leptin expression and lung cancer.

Each circle represents a separate study for the indicated association. These circles in the funnel plot implied no asymmetrical distribution, which means no publication biases were found.
