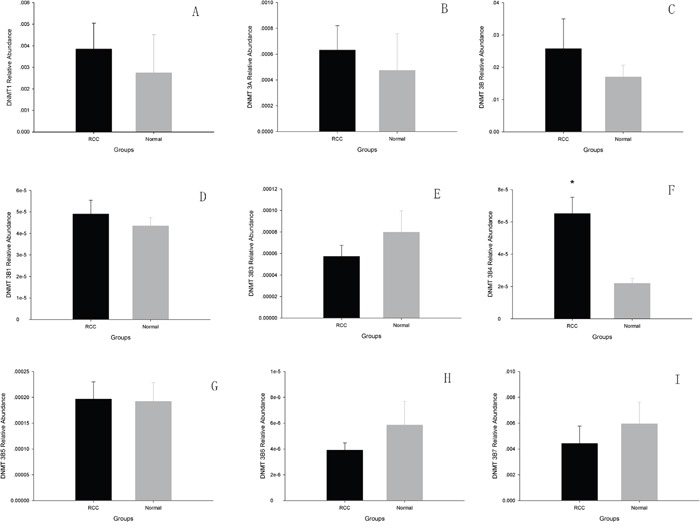
Figure 1. The analysis of DNMTs mRNA levels using Real-time PCR in ccRCC and adjacent normal tissues.

A. DNMT1; B. DNMT3A; C. total DNMT3B; D. DNMT3B1; E. DNMT3B3; F. DNMT3B4; G. DNMT3B5; H. DNMT3B6; I. DNMT3B7. (*p<0.05).

A. DNMT1; B. DNMT3A; C. total DNMT3B; D. DNMT3B1; E. DNMT3B3; F. DNMT3B4; G. DNMT3B5; H. DNMT3B6; I. DNMT3B7. (*p<0.05).