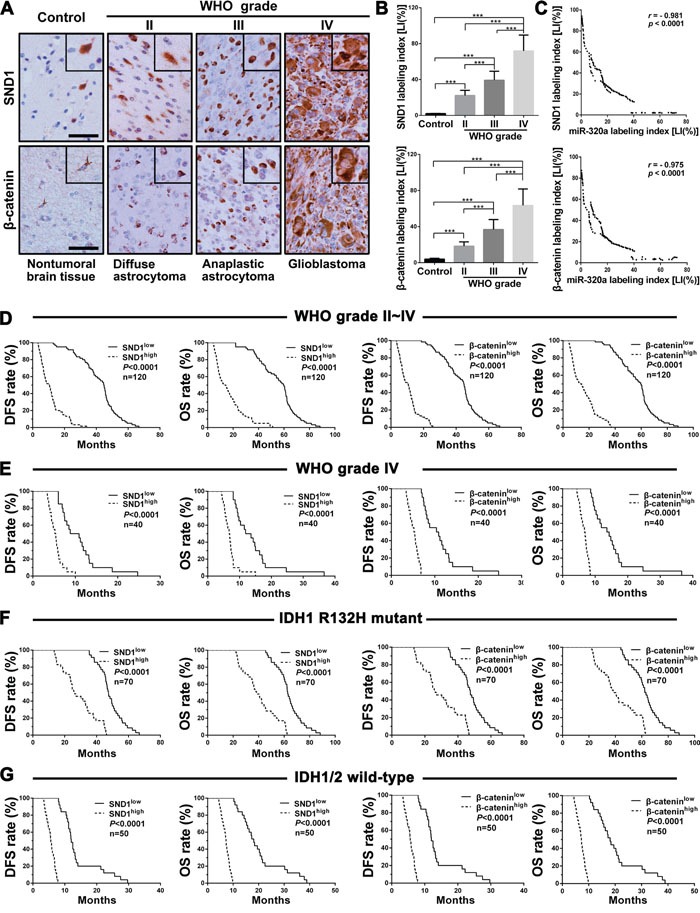
Figure 3. SND1 and β-catenin expressions correlate with grades, miR-320a expression, IDH status and prognosis in human gliomas.

A. Representative images of SND1 and β-catenin IHC detection. Scale bar, 50 μm. B. Comparisons among groups of SND1 and β-catenin expression levels [Labeling index (%), LI] in the FFPE samples of 120 gliomas and 20 nontumoral control brain tissues. The computing method of SND1 LI and β-catenin LI was the same as that of miR-320a (see Figure 1 legend) and the data in (B) are presented as the mean ± SD. *** P<0.001. C. Pearson correlation analysis between the expressions of miR-320a and SND1 or β-catenin in our FFPE samples. D-G. Kaplan-Meier analysis of the correlation between SND1 or β-catenin and DFS (left) or OS (right) of all the glioma patients (D) and the patients with grade IV (E), IDH1 R132H mutant (F) and IDH1/2 wild (G) gliomas. Patients were stratified into high and low expression subgroups using the median of SND1 or β-catenin LIs.
