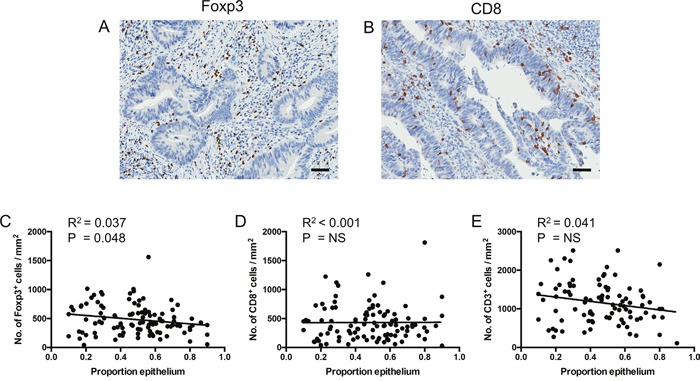
Figure 4. Foxp3+ cell density is inversely proportional to epithelial content.

A and B. Representative images (from different patients) demonstrating Foxp3+ cells located in the stroma (A) and CD8+ cells infiltrating the epithelium (B). Scale bar, 50μm. C to E. Linear regression analyses of T cell subset density by estimated epithelial tissue content across fragments. Dots represent individual patients. Data represent totals across all fragments analysed. NS = not significant.
