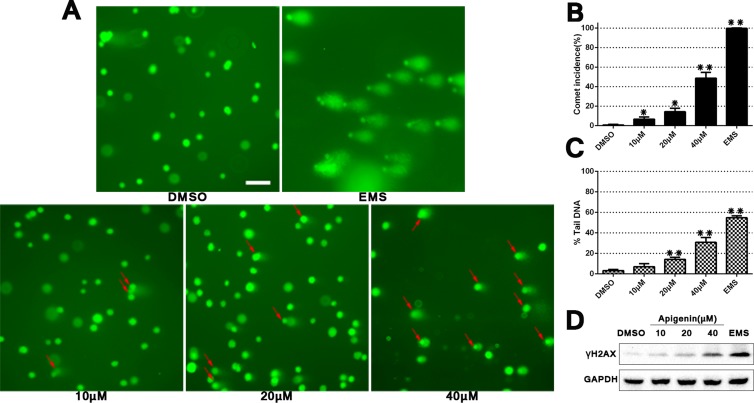
Figure 2. Apigenin treatment induces DNA damage in ACHN cells.
Comet assay using 4S Green Plus dye following cell treatment with various apigenin concentrations (A) Red arrows specify cells with a “comet tail,” which indicates DNA damage. Scale bar = 25 μm. Comet formation incidences in each group were measured using 100 randomly selected cells, and DNA damage level was calculated using CaspLab software in accordance with % tail DNA (B–C). Western blotting analysis of γH2AX D. *P < 0.05, **P < 0.01 versus untreated control.

