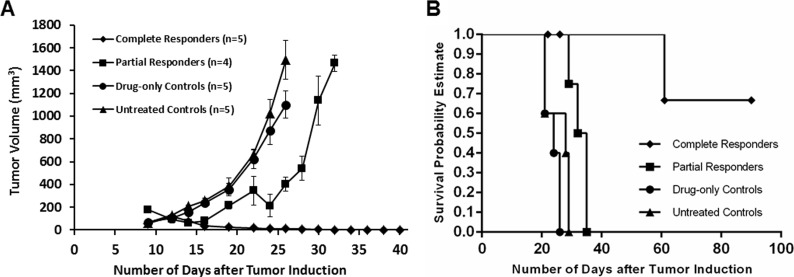
Figure 7.
Mean tumor volume chart (A) and survival curve (B) plotted as a function of days after tumor induction show that complete responders remained tumor free for the duration of the study (up till 9 months post-PDT, data plotted till 40 days), while partial responders (mice which received repeat PDT) had a slight delay (about one week) in tumor growth progression compared to drug-only and untreated controls.

