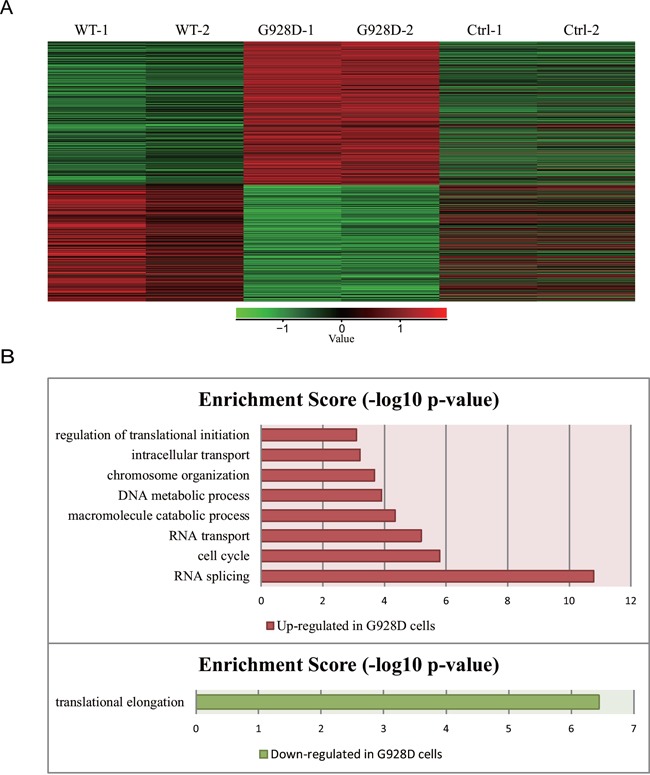
Figure 3. 899 genes were differentially expressed between G928D and WT cells.

A. Heatmap data from the RNA-sequencing analysis. 899 genes were significantly differentially expressed between G928D and WT cells (experiment conducted in duplicate, FDR<0.01). Red and green indicates expression at relatively high and low levels, respectively. B. Gene Ontology (GO) analysis of the 899 genes, which described the biological processes of the up-regulated or down-regulated genes in G928D cells compared with WT cells. p-value is the adjusted p-value (FDR). WT=wild-type BRDT.
