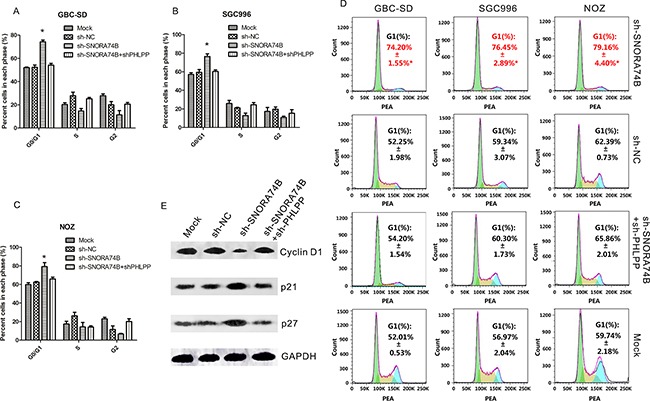
Figure 3. SNORA74B silencing induced G1 arrest of GBC cells.

A-C. The relative cell numbers in G0/G1, S, and G2 phase after propidium iodide staining of SNORA74B-silenced cells were determined by FACS. D. FACS data was analyzed using FlowJo v7.6.2 (Tree Star, Ashland, OR, USA). Data are presented as mean ± S.D. E. Expression of G1 checkpoint regulators p21, p27, and cyclin D1 were examined by western blotting, and the values of relative density of the bands normalized to GAPDH are shown.
