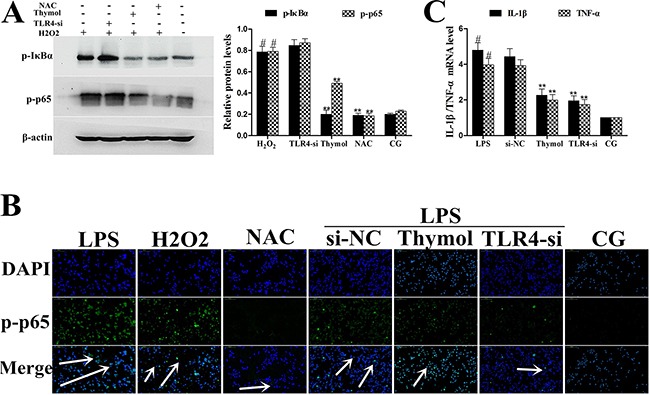
Figure 10. A. Effects of H2O2 on NF-κB activation after silencing of TLR4 in RAW264.7 cells.

Phosphorylation levels of p65 and IκBα were determined by western blotting after knockdown of TLR4 using siRNA or thymol, NAC pre-treatment. β-actin serves as an internal control. B. Translocation of NF-κB p65 in TLR4-si RAW264.7 cells challenged with LPS as assessed using immunofluorescence. C. Expression of the cytokines, IL-1β and TNF-α, was detected using qPCR. GAPDH served as a control. CG indicates the control group. LPS indicates the LPS-stimulated group. TLR4-si indicates the TLR4 siRNA group. NAC indicates the N-acetyl cysteine group. The white arrow indicates the translocation of p65. Data represent the mean ± S.E.M. of three independent experiments. #p<0.01 vs. Control group. *p<0.05 vs. LPS group, **p<0.01 vs. LPS group.
