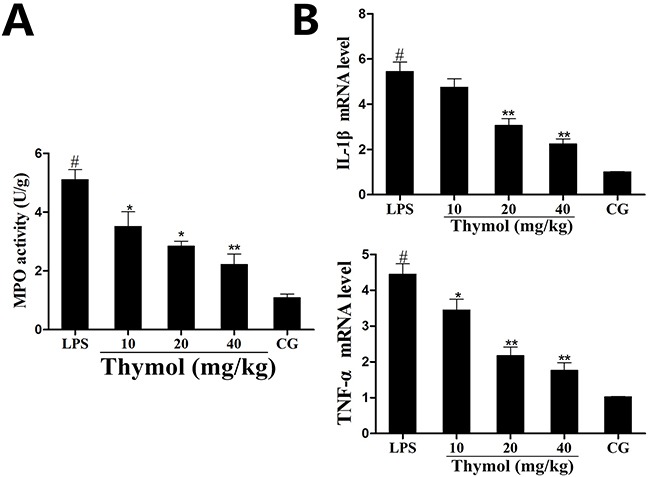
Figure 3. Effects of thymol on MPO activity and cytokine expression.

A. MPO activity. B. Expression of TNF-α and IL-1β mRNA in tissues. GAPDH serves as the control. CG indicates the control group. LPS indicates the LPS-stimulated group. Data represent the mean ± S.E.M. of three independent experiments. #p<0.01 vs. Control group. *p<0.05 vs. LPS group, **p<0.01 vs. LPS group.
