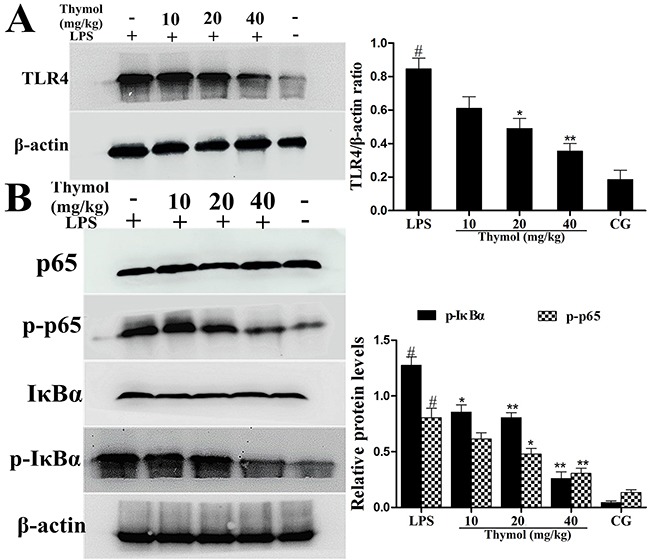
Figure 4. Effects of thymol on TLR4 expression and NF-κB pathway activation.

A. TLR4 protein expression levels in uterine tissues. B. Expression of the p65 and IκBα proteins in uterine tissues. Phosphorylation of p65 and IκBα was analyzed using phospho-specific antibodies. β-actin served as an internal control. CG indicates the control group. LPS indicates the LPS-stimulated group. Data represent the mean ± S.E.M. of three independent experiments. #p<0.01 vs. Control group. *p<0.05 vs. LPS group, **p<0.01 vs. LPS group.
