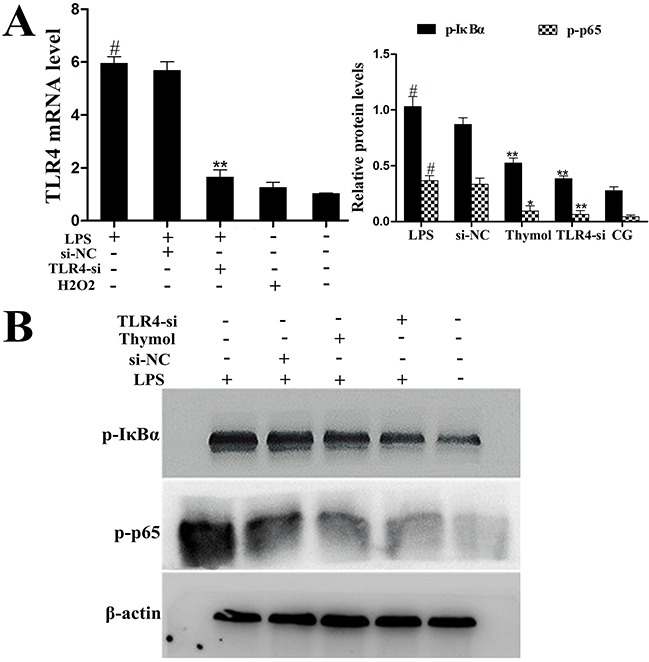
Figure 9. Analysis of TLR4-mediated NF-κB pathway expression in LPS-stimulated RAW264.7 cells.

A. The interfering efficiency of TLR4 siRNA was estimated using qPCR. GAPDH served as a control. B. Phosphorylation levels of p65 and IκBα were examined by western blotting after silencing of TLR4 using siRNA or thymol treatment in LPS-stimulated RAW264.7 cells. CG indicates the control group. LPS indicates the LPS-stimulated group. TLR4-si indicates the TLR4 siRNA group. si-NC indicates the siRNA-negative control group. Data represent the mean ± S.E.M. of three independent experiments. #p<0.01 vs. Control group. *p<0.05 vs. LPS group, **p<0.01 vs. LPS group.
