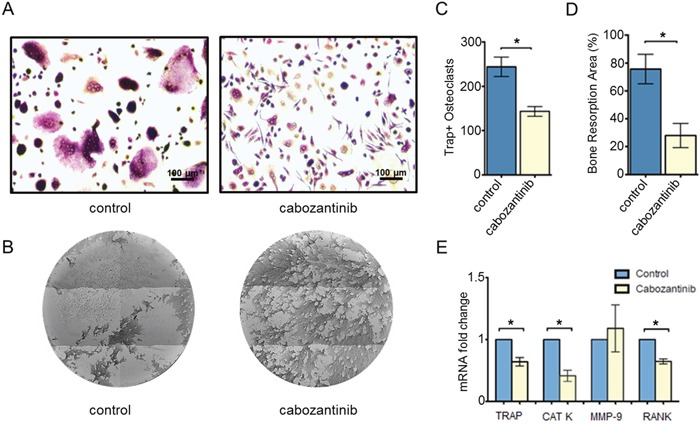
Figure 1. Effect of cabozantinib treatment on primary osteoclasts.

A. Representative images of Trap Assay in untreated or treated osteoclasts (DMSO). B. Representative images of Osteoassay in untreated or treated osteoclast (DMSO) which show bone matrix (dark color) and resorption pits (light color) C. Count of TRAP+ osteoclasts (≥ 3 nuclei) and D. quantification of bone resorption area in untreated or treated osteoclasts. E. Modulation of TRAP, CAT K, MMP-9 and RANK expression levels (Real Time PCR) following cabozantinib treatment *(p < 0.05)
