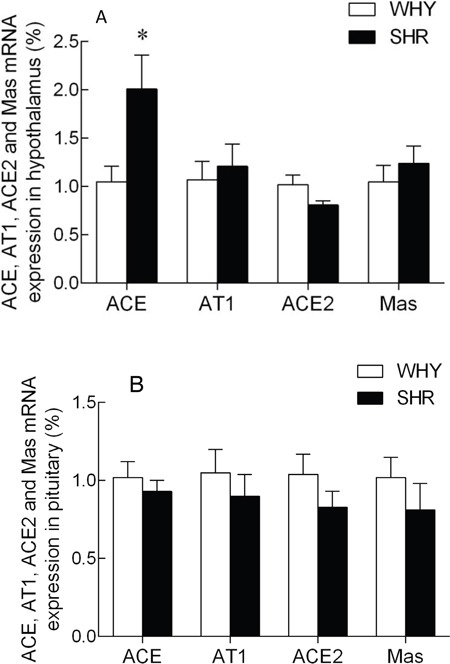
Figure 3. The expression of ACE, AT1R, ACE2 and MasR mRNA in hypothalamus and pituitary of SHR compared with WKY.

Note: A: the expression of ACE, AT1A, ACE2 and MasR mRNA in SHR hypothalamus compared with that of WKY group, * P<0.05; B: the expression of ACE, AT1B, ACE2 and MasR mRNA in SHR pituitary compared with that of WKY group, * P<0.05.
