
Figure 1. Use of fluorescent microscopy to assess the locations of metastatic lesions in ex vivo organ samples and the growth patterns of the subsequent pure metastatic cell lines.
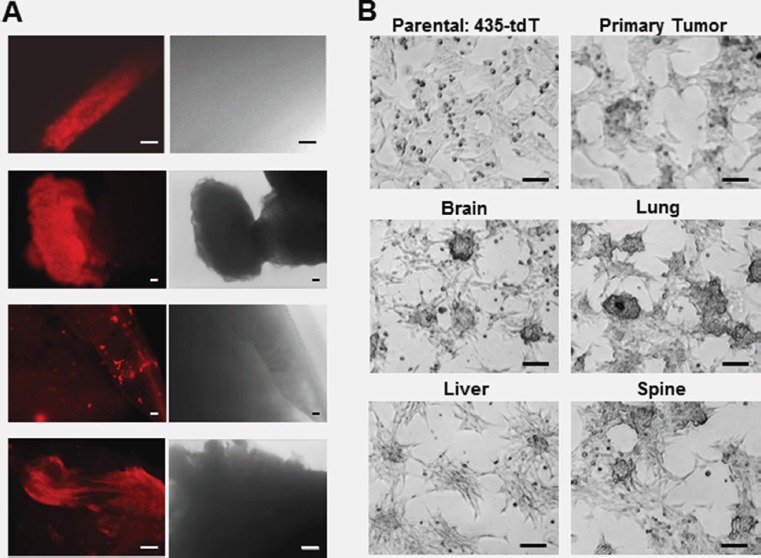
(A) Fluorescence and corresponding phase-contrast images of brain, liver, lung, and spine tissue explants immediately after dissection. (B) Phase contrast images of the different colony growth patterns of pure brain, liver, lung, and spine metastatic sublines as well as the primary tumor cell line, compared to the monolayer growth pattern of parental 435-tdT cells. Microscopy was on a Nikon eclipse TS100 inverted microscope using in (A) a 10× objective for brain and spine or 4x objective for liver and lung images, while all images in (B) were obtained using a 10× objective. Microphotographs were acquired using a Roper Scientific CoolSnap™ ES camera, images were captured with NIS-Elements F3.2 software, and processed with ImageJ. Scale bars in all images depict 100 μm.