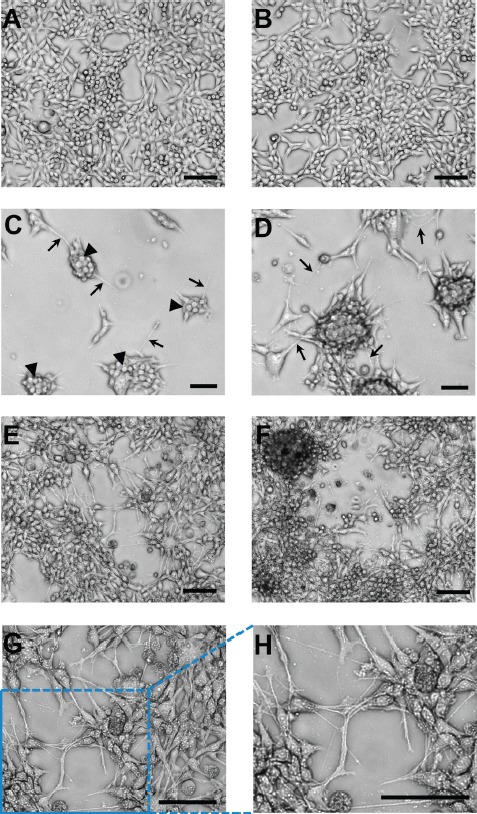
Figure 2. Representative images of the brain cell line growth patterns on adherent plastic compared to monolayer growth of the parental cell line.

(A–B) Two fields-of-view of characteristic monolayer growth of the parental cell line. (C) Distinct separate colony growth was apparent at 48 hr post inoculation of the plate with distinct small spherical cells making up each colony (arrowheads) and thin cellular extensions/filopodia (micro- or nanotubes; arrows). (D) After 120 hr the interconnected colony pattern remained. (E–F) Two examples of the characteristic growth pattern at “confluency” of the brain cell line with colonies elaborately linked together by nanotubes. These interconnections between cells/colonies have consistently been recorded at > 100 μm in length (see scale bars). (G) Higher magnification of the central portion of image (E). (H) Expanded image of the lower left-hand corner of image (G). These magnified images allow for a very clear visualization of the complex and intricate web of interconnections between colonies that were in place. Microscopy was on a Nikon eclipse TS100 inverted microscope using for (A–F) a 10x objective and for (G) a 20× objective. Both objectives were used in combination with a 4× phase contrast ring, which produced the high resolution 3D-like images. Microphotographs were acquired using a Roper Scientific CoolSnap™ ES camera, images were captured with NIS-Elements F3.2 software, and processed with ImageJ. Scale bars in all images depict 100 μm.
