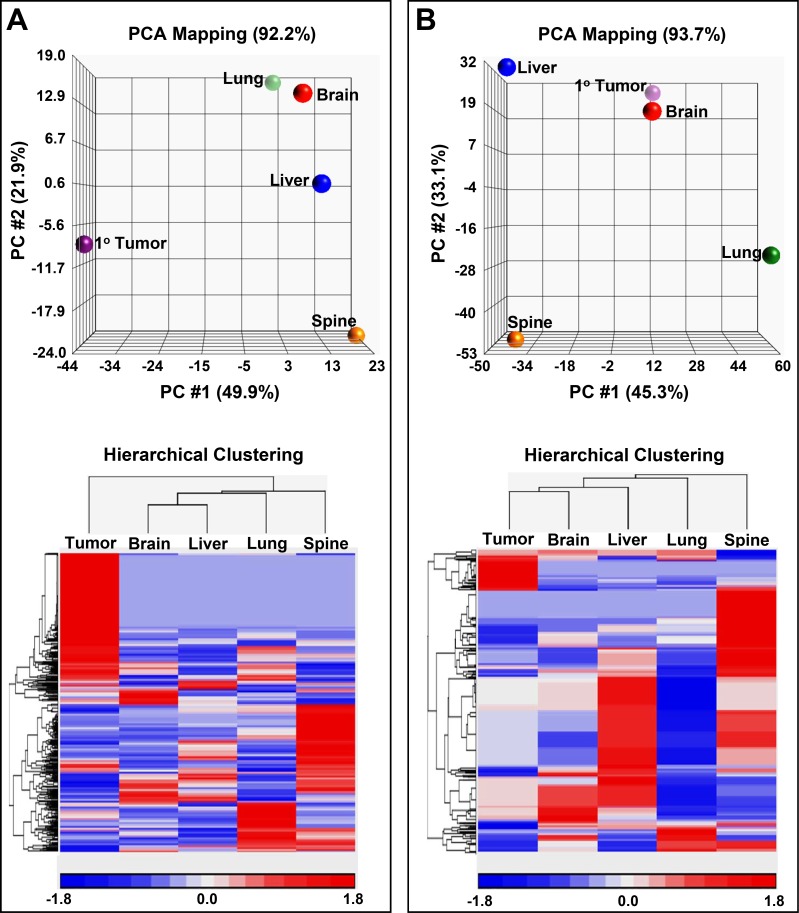
Figure 5. Principal component analysis (PCA) maps along with hierarchical clustering's of metabolites and lipids.
(A) 3D PCA mapping of aqueous metabolites (top panel) displaying sample classes as spheres. Bottom panel displays hierarchical clustering of the samples along with the associated heat map of aqueous metabolite distributions. (B) 3D PCA mapping of lipid soluble metabolites (top panel) with spheres representing the sample classes. Panel at the bottom displays a heat map of lipid soluble metabolite distributions along with the associated dendrogram. Expression values for the heat maps are indicated by a key at the bottom of the maps.

