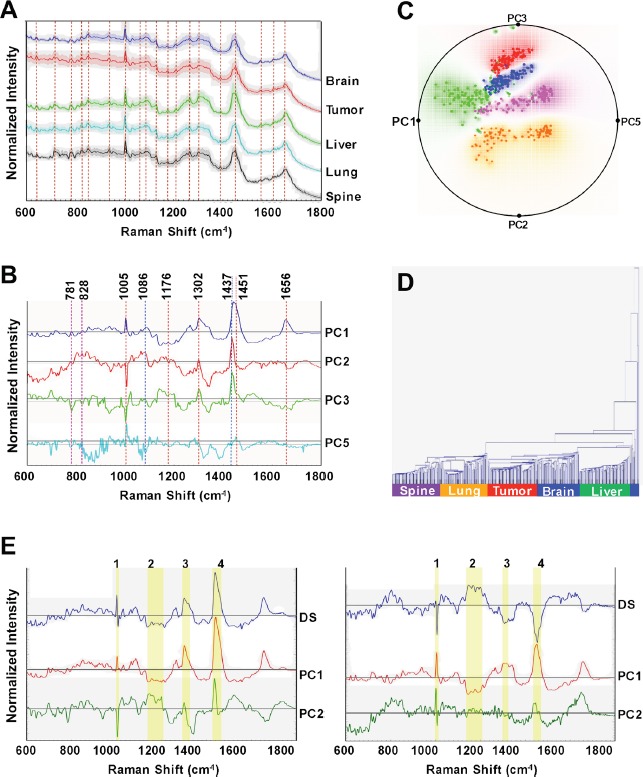
Figure 6. Raman spectroscopic analyses of organ-specific metastatic breast cancer cell lines reveals distinct spectral characteristics for each cell line.

(A) Representative Raman spectra acquired from brain, primary tumor (1oTumor), liver, lung, and spine cell lines. The solid profile depicts the mean spectrum of each sample group and the shadow represents ±1 standard deviation. Spectra were normalized and offset for visualization. Dashed vertical lines delineate Raman shifts (cm−1) detailed in Table 3. (B) Principal component (PC) loadings for PC 1, 2, 3 and 5, for the Raman measurements are shown. Dashed vertical lines delineate prominent Raman shifts (cm−1) detailed in Table 3. (C) Radial visualization principal component scores plot, corresponding to the most discriminative PCs (PC1, 2, 3, and 5), shows the clustering of the spectral data corresponding to each organ-specific cell line, red: primary tumor, blue: brain, green: liver, orange: lung, and purple: spine. (D) Dendrogram of organ-specific breast cancer cell lines cluster analysis. Each color bar represents one organ-specific cell line. (E) Identification of informative spectral regions via PCA data exploration as exemplified by the PC loadings corresponding to the spectral dataset acquired from: primary tumor and liver (left panel) and primary tumor and spine (right panel) cell lines. The top to bottom profiles in each panel show difference spectra: (DS) between liver/primary or spine/primary spectra along with their PC1 and PC2 loadings, respectively. The highlighted yellow bars (1–4), represent the wavelength regions elucidated from the difference spectra (DS) as those with the most significant variability amongst the considered cell lines.
