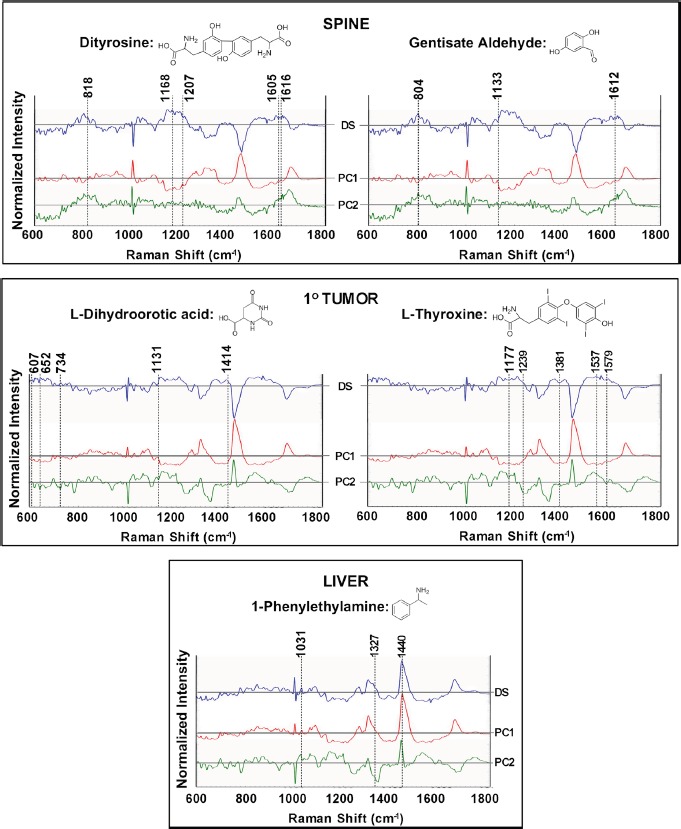
Figure 7. Raman spectroscopic analysis to probe the presence of cell line specific expression of molecules identified through metabolomics analysis.

The top panel highlights the differential expression of spectral markers in the spine cell line. The primary cell line spectrum was used as the control to calculate the difference profiles. Additionally, principal components (PC) 1 and 2, calculated from the spine and primary cell line data, are provided to capture the variance. The presence of spectral features, corresponding to the peaks of dityrosine and gentisate aldehyde, are highlighted by the dashed lines and detailed vibrational mode assignment is presented in Table 5. Similarly, the middle panel compares the Raman spectra of the primary cell line with a control group, i.e., Raman spectra acquired from the liver cell line, to illustrate the presence of features of overexpressed metabolites L-dihydroorotic acid and L-thyroxine. The bottom panel compares the Raman profiles of the liver cell line with the control group (primary) to delineate the overlap with features of 1-phenylethylamine. Profiles in blue represent the difference spectra: (DS) whereas the red and green profiles show the PC1 and PC2 loadings respectively for each chosen pair of cell lines.
