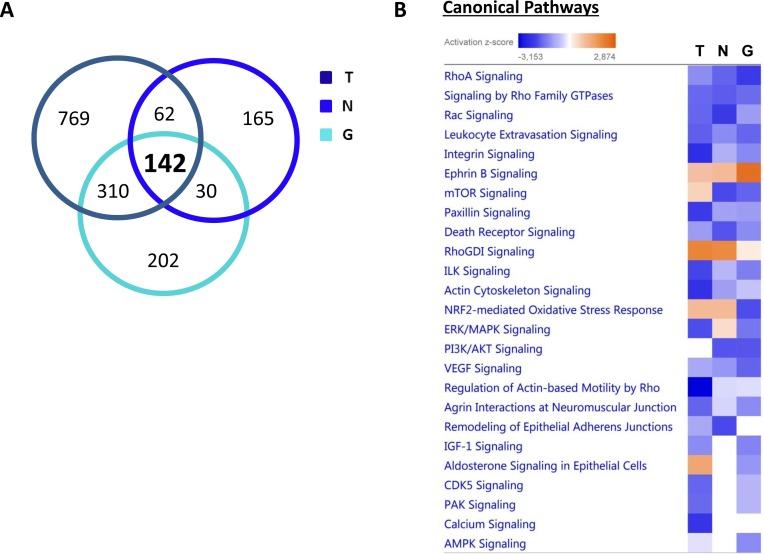
Figure 17. Overview of proteins and pathways identified as differentially regulated in the lysates of TAMR, NQO1 and GCLC cells relative to control MCF7 cells, by Ingenuity Pathway Analysis.
A. Venn diagram. Overlap of differentially regulated proteins identified in MCF-7-TAMR, MCF-7-NQO1 and MCF-7-GCLC, compared with their proper controls. Of all the proteins identified by quantitative proteomics, 142 were proteins that the expression of which was found to be altered in both treatments, compared to control. B. Canonical pathways identified or predicted as altered in MCF-7-TAMR, MCF-7-NQO1 and MCF-7-GCLC, relative to control. A positive z score is indicated in orange and points towards an activation of the pathway, and a negative z score, in blue, indicates an inhibition of the pathway. (T = MCF-7-TAMR vs. MCF-7-control; N = MCF-7-NQO1 vs. MCF-7-LV105; G = MCF-7-GCLC vs. MCF-7-LV105).

