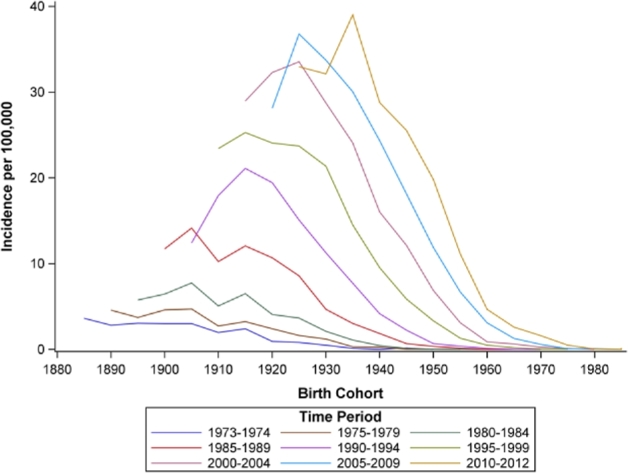
Fig. 4.

Birth cohort by time period incidence rates of esophageal adenocarcinoma for white males, SEER 9, 1973–2012. Note: In the above figure, birth cohort is along the x-axis, and each line represents incidence rates across birth cohort for approximate 5-year time periods. Incidence of EAC increased across the 1900-1930 birth cohorts and decreased successively across more recent birth cohorts.
