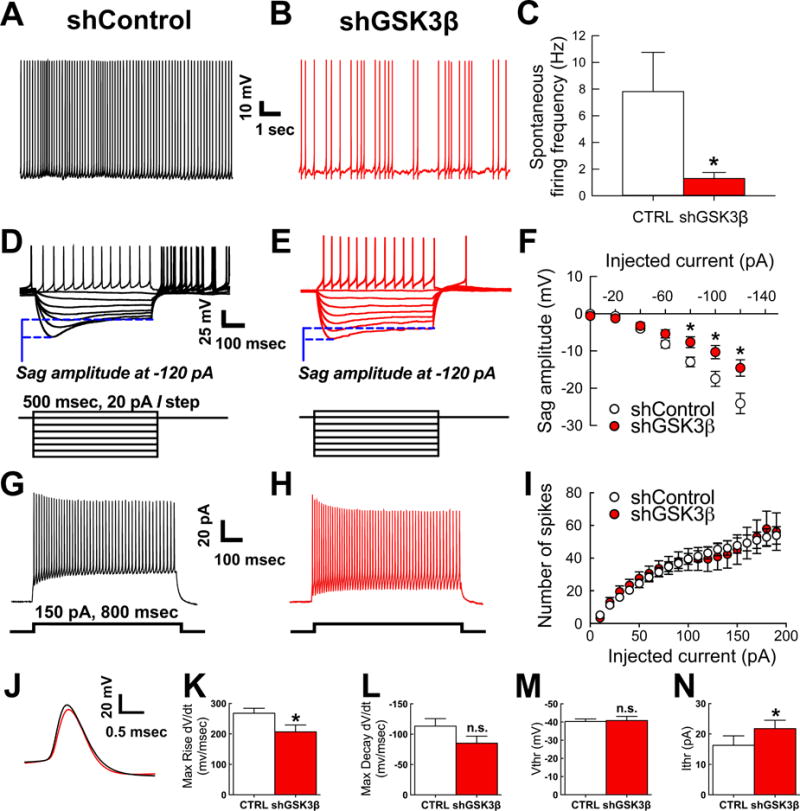
Figure 5. Whole cell patch clamp recordings of neurons with spontaneous activity in both control vector and GSK3β knockdown vector show tonically active interneuron (TAN) phenotype and GSK3β knockdown in the NAcSh reduces spontaneous neuronal activity in identified tonically active interneurons (TANs).

A–B. Representative traces of spontaneous firing at resting membrane potential recorded from shControl (A) and shGSK3β (B) neurons in whole-cell patch clamp. C. Summary bar graph of action potential firing frequency recorded in whole cell, control n=13 cells and shGSK3β n=15 cells (mean±SEM). Control n=6 rats, shGSK3β n=8 rats. D–E. Passive properties of same neurons as A–B showing hyperpolarizing sag and action potential rebound in control (D) and shGSK3β knockdown (E) with injected current (500 msec, 20 pA/step). F. Summary graph of sag amplitude (mV) at different injected current (pA) showing reduced sag amplitude in GSK3β knockdown (n=18 cells) versus control (n=13 cells) (mean±SEM). Control n=6 rats, shGSK3β n=8 rats. G. and H. Representative traces from control vector (G) and shGSK3β vector (H) transduced TANs showing trains of evoked action potentials at 800 msec and 150 pA current step injection. I. Input-output curve of evoked AP trains in response to repetitive current steps of constant increment. J. Action potential waveforms evoked at the current threshold are illustrated for control (black line) or shGSK3β vector (red line) transduced TANs. K. Bar graph showing reduced maximum rise (dV/dt, mV/msec) in GSK3β knockdown (n=17 cells) versus control (n=16 cells) (mean±SEM); control n=6 rats, shGSK3β n=8 rats. L. Bar graph showing no significant difference in action potential maximum decay (dV/dt, mV/msec) in GSK3β knockdown (n=17 cells) versus control (n=16 cells) (mean±SEM); control n=6 rats, shGSK3β n=8 rats. M. Bar graph showing no difference in the action potential voltage threshold (Vtrh, mV) in GSK3β knockdown (n=17 cells) versus control (n=16 cells) (mean±SEM); control n=6 rats, shGSK3β n=8 rats. N. Bar graph showing increased current threshold (Itrh, pA) in GSK3β knockdown (n=17 cells) versus control (n=16 cells) (mean±SEM); control n=6 rats, shGSK3β n=8 rats. *p<0.05.
