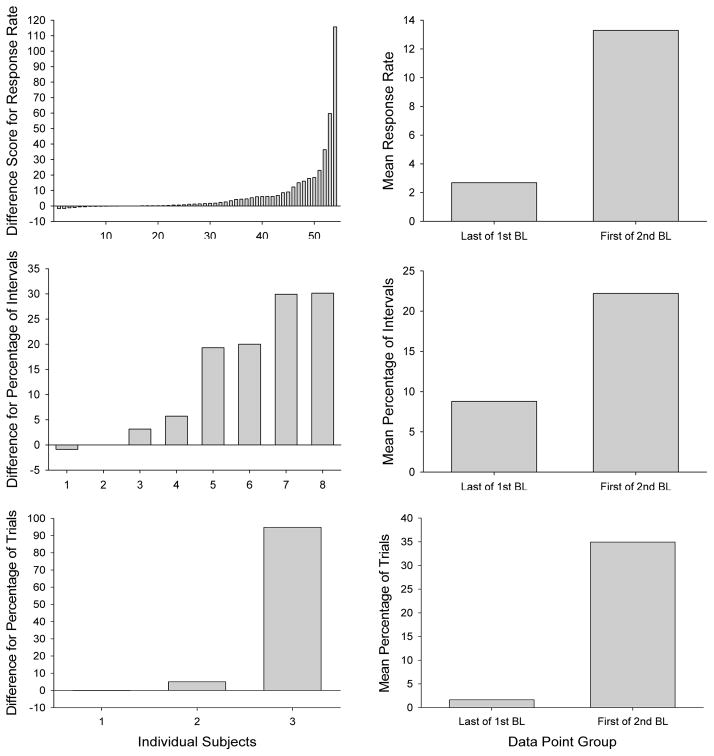
Figure 3.
Distribution of difference scores (first point of second baseline – last point of first baseline) in the left panels and mean responding for the last point of the first no-reinforcement phase and first point of the second no-reinforcement phase in the right panels, across data sets depicting response rates (top panels), percentage of intervals (middle panels), and percentage of trials (bottom panels).

