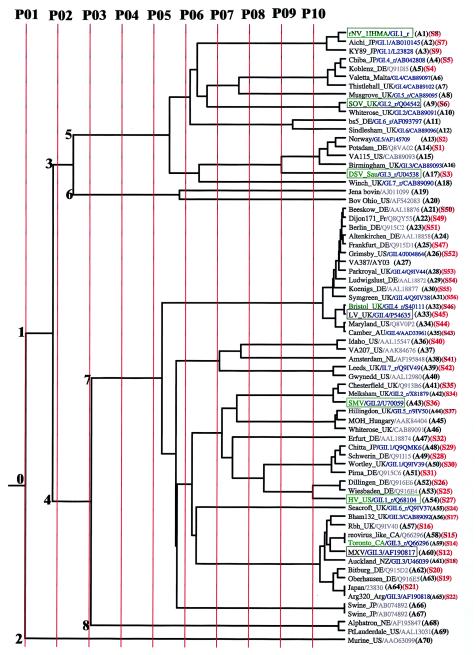
FIG.1.
The ET of the norovirus strains (A1 to A70) belonging to the two genogroups for the different partitions. A few randomly chosen duplicate sequences (A58/A59, A64/A65, and A66/A67) as positive controls in the sequence alignments and the tree construction appear correctly on the tree. The partition lines P01 to P10 shown in red indicate the extent of divergence (resolution) of the norovirus sequences. A subset, whose sequence numbers (S1 to S56) are shown in red, has been used for ET trace residue analysis. Sequences of known clusters in genogroups I and II are shown in blue as GI.n or GII.n, respectively, along with the appended “_r” if the sequence is a reference strain for the cluster (10). The EMBL and NCBI database accession numbers are shown following the strain names and cluster numbers if applicable. The strain names reflect the names of the places or regions where the strains were first isolated. The name of the country is shown as a two-letter code (except where the name is obvious) along with the strain name. These codes are as follows: AU, Australia; CA, Canada; DE, Germany; Fr, France; JP, Japan; NL, Netherlands; NZ, New Zealand; Sau, Saudi Arabia; UK, United Kingdom; US, United States. The prototype strains refer to the first strain that was isolated within a given cluster (10). The antigenic strains are shown within boxes, and the prototype strains are shown in green. Antigenic norovirus strains that are also prototypic are shown in green and are enclosed within boxes. The numbers (0 to 8) refer to the different nodes of the tree. Node 0 is the root node that is the parent node of child nodes 1 and 2. Similarly, node 1 is the parent node of child nodes 3 and 4, node 3 is the parent node of child nodes 5 and 6, and node 4 is the parent node of the child nodes 7 and 8.

