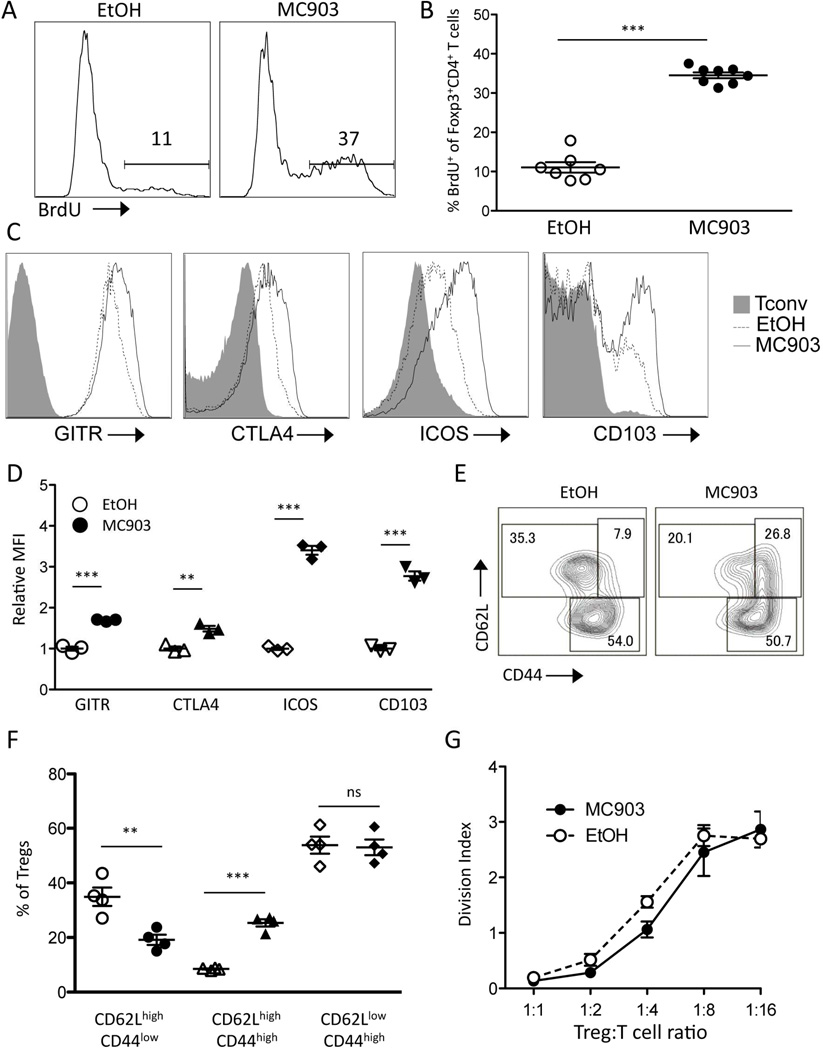
Fig. 4.
Topical MC903 treatment augments Treg proliferation and expression of activation markers but not suppressive function. (A) C57BL/6 mice were treated with EtOH and MC903 (2nmol/ear) for 8 days and administered BrdU for the last 3 days of treatment. Representative histogram plots and (B) the percent of Tregs incorporating BrdU at day 9 plotted as mean ± SEM (n = 7–8 mice/group of two independent experiments) is shown. (C) Representative histogram plots of phenotypic surface markers (GITR, CTLA4, ICOS, and CD103) expressed by Tregs and (D) their MFI relative to EtOH control in the spleen at day 8 plotted as mean ± SEM (n = 3 mice/group) is shown. (E) Representative density plots of CD62L and CD44 expressed by Tregs and (F) the % of Tregs within each subset in the spleen at day 8 is plotted as mean ± SEM (n = 4 mice/group) is shown. (G) The ability of Tregs from MC903 or EtOH-treated mice to suppress anti-CD3-stimulated Tconv division at different Treg:Tconv ratios plotted as mean ± SEM of triplicate cultures is shown. **p<0.01 and ***p<0.001 by Student’s t test.

