
Figure 1.
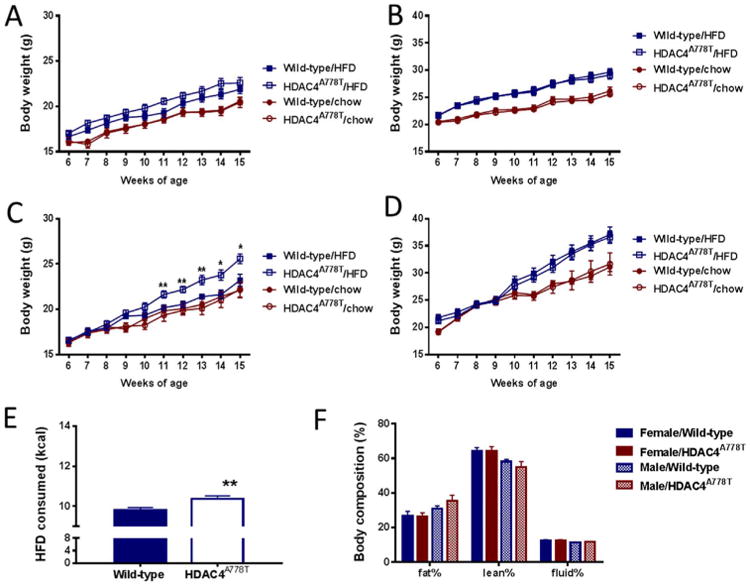
Body weight homeostasis in HDAC4A778T mice. Six-week old HDAC4A778T mice were given access to regular chow or high-fat diet (HFD) and body weight was monitored until 15 weeks of age for individually housed (A) female (n = 10–14 per group) and (B) male mice (n = 8–12 per group) and group-housed (C) female (n = 8–9 per group, significant diet × genotype interaction by two-way analysis of variance F9,160 = 2.576, p = .0085) and (D) male mice (n = 7–11 per group). (E) Food intake group-housed female mice receiving HFD (n = 8–9 per group, p = .008 by t test). (F) Body composition of group-housed mice. Data presented as mean ± SEM. *p < .05, **p < .01 indicate significant differences.