
Figure 3.
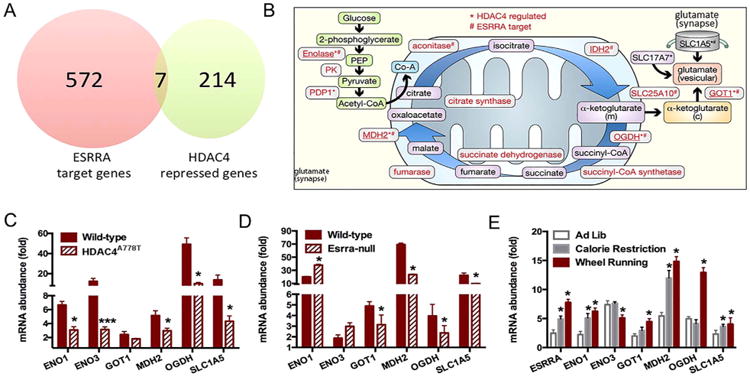
Identification of a HDAC4-ESRRA target pathway. (A) Venn diagram of ESRRA target genes and HDAC4 repressed genes. (B) Schematic representation of synaptic glutamate synthesis pathway. (C) Measure of messenger RNA (mRNA) abundance by quantitative polymerase chain reaction in cortex of female group-housed HDAC4A778T mice (n = 6 per group), (D) female ESRRA-null mice (n = 6 per group), and (E) wild-type female mice subjected to 60% calorie restriction or wheel running (n = 6 per group). Data presented as mean ± SEM. *p < .05 and ***p < .001 indicate significant differences between the groups by t test.