
Figure 2.
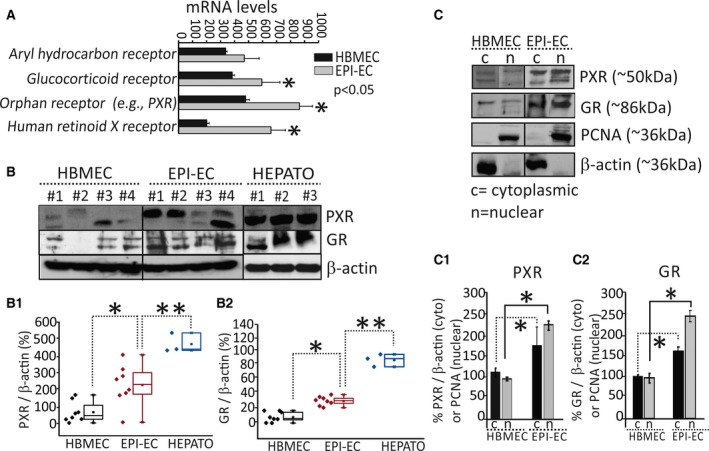
PXR and GR expression patterns in human EPI‐ECs. (A) The mRNA levels of NRs (human retinoid x receptor, RXR; aryl hydrocarbon receptors, AHRs; glucocorticoid receptors, GRs); and orphan receptors [e.g., pregnane X receptors, PXRs]) in EPI‐ECs were significantly increased (*p < 0.05, n = 4) compared to controls (HBMECs). (B–B2) PXR and GR protein expression evaluated by Western blot showed variability among the samples analyzed; increased levels of PXRs (*p < 0.05) and GR (*p < 0.05) were found in EPI‐ECs compared with HBMECs (B1–B2) (n = 8). Representative Western blots are shown in B for PXR/GR (n = 4/each, HBMEC or EPI‐ECs). The hepatocytes (HEPATO) consistently showed an increased level (**p < 0.01, n = 3) of PXRs and GRs as compared to EPI‐ECs. Glyceraldehyde 3‐phosphate dehydrogenase and β‐actin were used as loading controls for mRNA and protein, respectively. Results are expressed as mean ± standard error of the mean (SEM) (analysis of variance, ANOVA). (C–C2) Western blot results increased levels of PXR and GR in the cytoplasmic and nuclear (*p < 0.05, n = 4) EPI‐ECs fractions. β‐Actin was used as a loading control for cytoplasmic fractions; proliferating cell nuclear antigen (PCNA) was used for nuclear fractions. Results are expressed as mean ± SEM (ANOVA).