Figure 3.

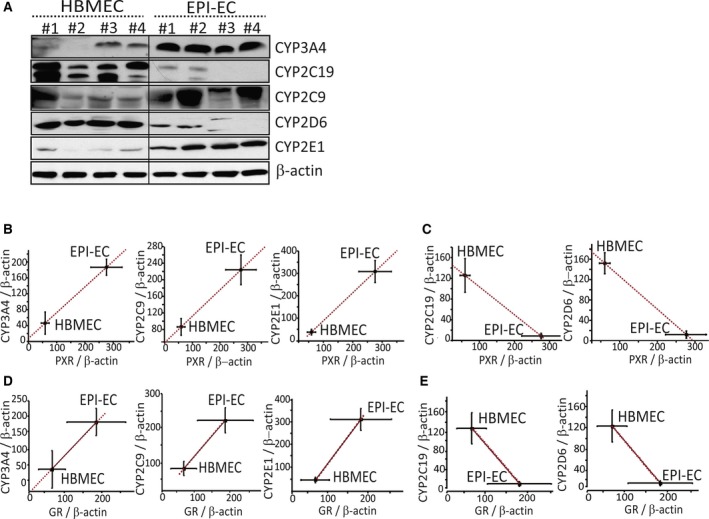
Overexpression of specific CYPs and correlation with PXR and GR protein levels in EPI‐ECs. (A) Western blot showing elevated expression of CYP3A4, CYP2C9, and CYP2E1 in EPI‐ECs (1 to 4), compared to HBMECs (1 to 4). In contrast, CYP2D6 and CYP2C19 were down‐regulated or absent. Quantitative analysis of protein expression and correlation of PXR/GR with CYP levels showed that CYP3A4, CYP2E1, and CYP2C9 levels increased significantly in accordance with increases in PXR (B) and GR (D) expression in EPI‐ECs. CYP2C19 and CYP2D6 showed decreased levels in correlation with decreased levels of PXR (C) or GR (E) expression in EPI‐ECs compared with HBMECs (n = 4/each for HBMECs or EPI‐ECs, in triplicate). Results are expressed as mean ± SEM (ANOVA) and were normalized with β‐actin as loading control.
