
Figure 2.
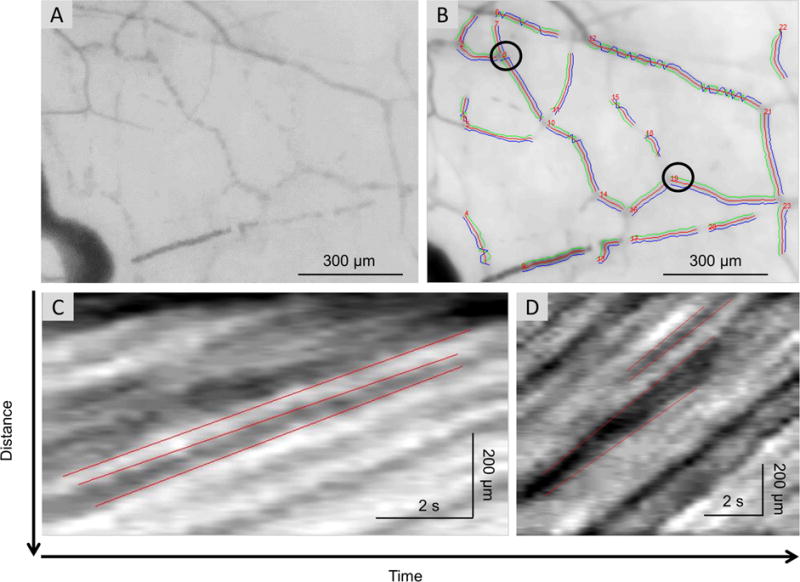
Measurement of the vessel diameter and blood flow velocity. Custom software was developed and utilized to process the video clips obtained on the bulbar conjunctiva. The first frame (A) of the video clip was used for registering all frames to compensate for the eye motion. After that, all registered images were averaged and the blood vessels were segmented from the average image. The vessels were automatically identified and marked in numbers (B). The vessel walls were outlined and marked in green and blue lines for measuring the vessel diameter (B). By calculating the image intensity within the areas defined by the vessel walls, an intensity profile along the center line between these walls was generated for each frame. Using all intensity profiles of all frames in the video clips, a space-time image was obtained and used to measure the blood flow velocity. The slopes of the bands (i.e. moving distance over time) were manually outlined (marked in red lines) and calculated as the measurements of axial blood flow velocity (C for vessel No. 8, D for vessel No. 19).