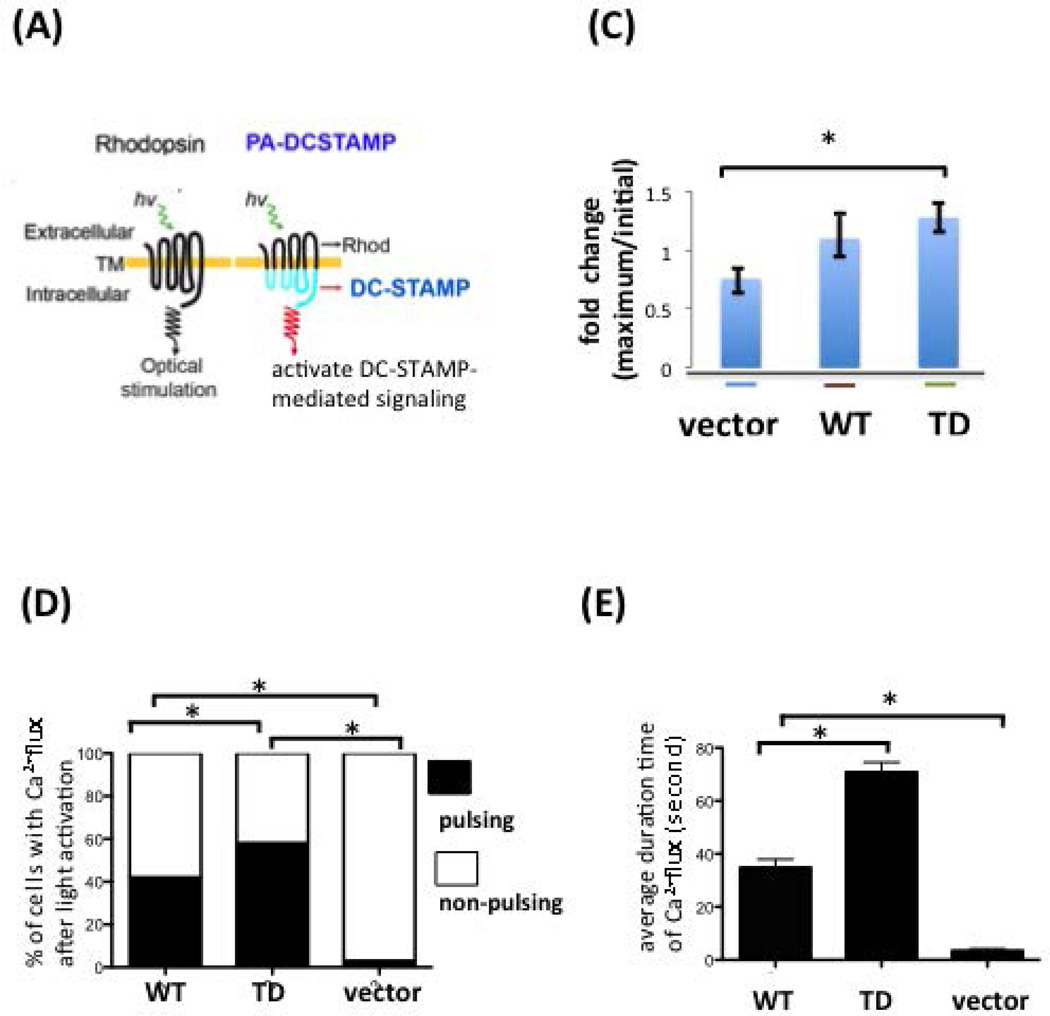
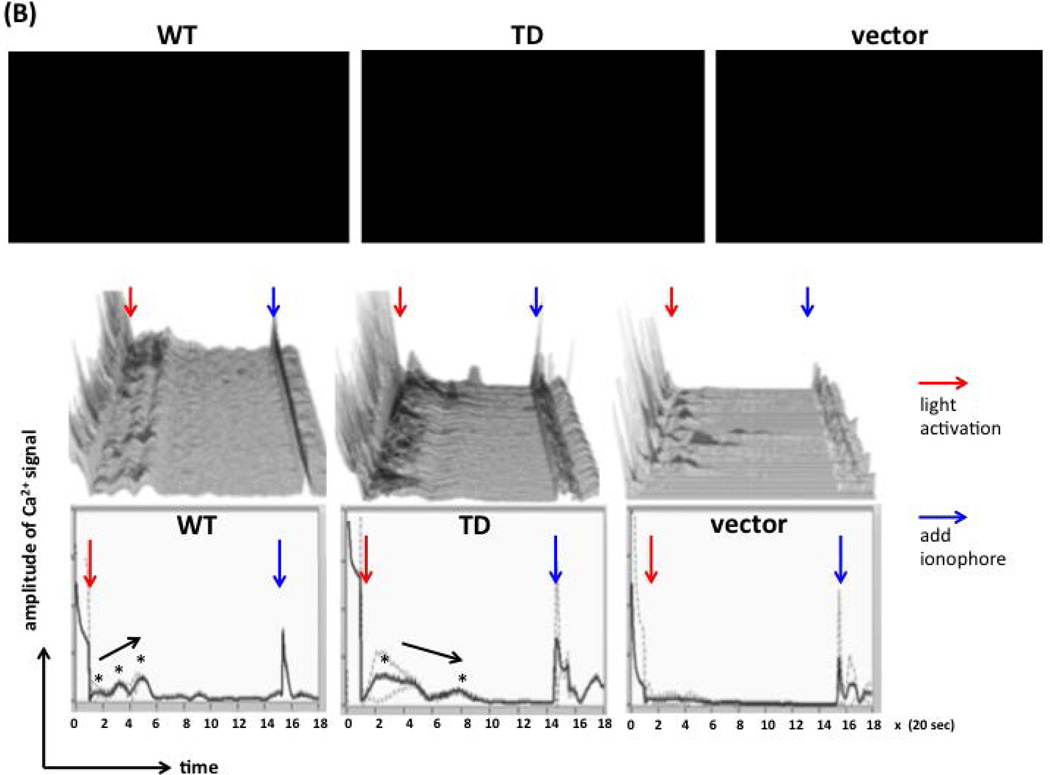
Figure 6. Intracellular Ca2+ flux was altered by ITIM deletion on the DC-STAMP cytoplasmic tail.
(A) The design of the photoactivatable DC-STAMP (PA-DC-STAMP) chimeric construct. Rhod, rhodopsin.
(B) Ca2+ flux assays on WT- or TD-DC-STAMP-overexpressing cells. 293T cells were transiently transfected with WT- or TD-DC-STAMP constructs, labeled with the Fluo-4 Ca2+ dye, and activated with 488-nm light. Cells expressing the PA constructs were selected and identified by the expression of red m-Cherry proteins. Top row: Three videos were recorded for 6 minutes after light activation. Middle row: 120 m-cherry+ cells in each video were selected and the Ca2+ signals, as represented by the green fluorescence, were depicted and converted into curves in a 0.01 second interval using the Amira software. Bottom row: Curves derived from cumulative Ca2+ signals from 120 m-cherry+ cells in each video. The starting and end points of experiments are defined by the light activation (red arrows) and ionophore addition (blue arrows). Click the  button to start each video. Ca2+ pulses are labeled with black asterisks, and the arrows close to the spikes indicate the trend of Ca2+ signal strength.
(C) Fold change of intracellular Ca2+ flux before (a) and after (b) light activation on 293T cells transfected with vector, WT-, or –TD-PA-DCSTAMP. A significant difference in Ca2+ flux was detected between the ITIM-deleted PA mutant and vector control (mean +/− SEM; * P ≤ 0.05).
(D) Percentage of WT- and TD- DCSTAMP-expressing 293T cells that showed Ca2+ flux after light activation. * P ≤ 0.05.
(E) Duration time of intracellular Ca2+ signals after light activation in WT-, TD-DCSTAMP, & vector- transfected 293T cells. *P ≤ 0.05.


