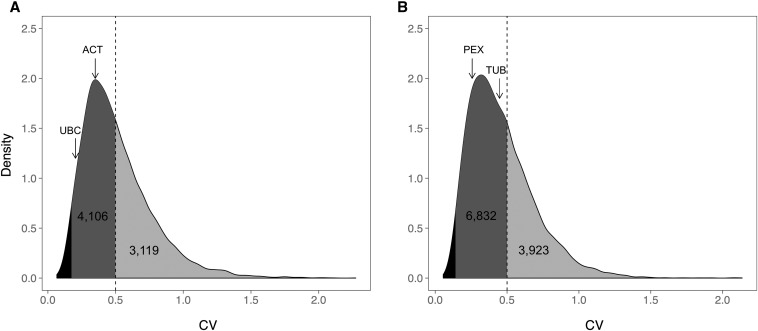
Figure 2.
Distribution of CV for all reliably expressed genes (>5 FPKM in all samples) in (A) M. guttatus and (B) M. l. luteus. The dashed line marks the 0.50 CV cut-off for stably expressed genes and the arrows point to the two traditional reference genes with the lowest variation in expression for each species (Table S2). The portion of the density curves containing the top 200 genes with the lowest CV are shaded black; all genes selected using the CV and fold change method fall within this region. ACT, actin 2/7; CV, coefficient of variation; FPKM, fragments per kilobase per million reads; PEX, peroxin 4; TUB, β-tubulin 2; UBC, ubiquitin-conjugating enzyme.

