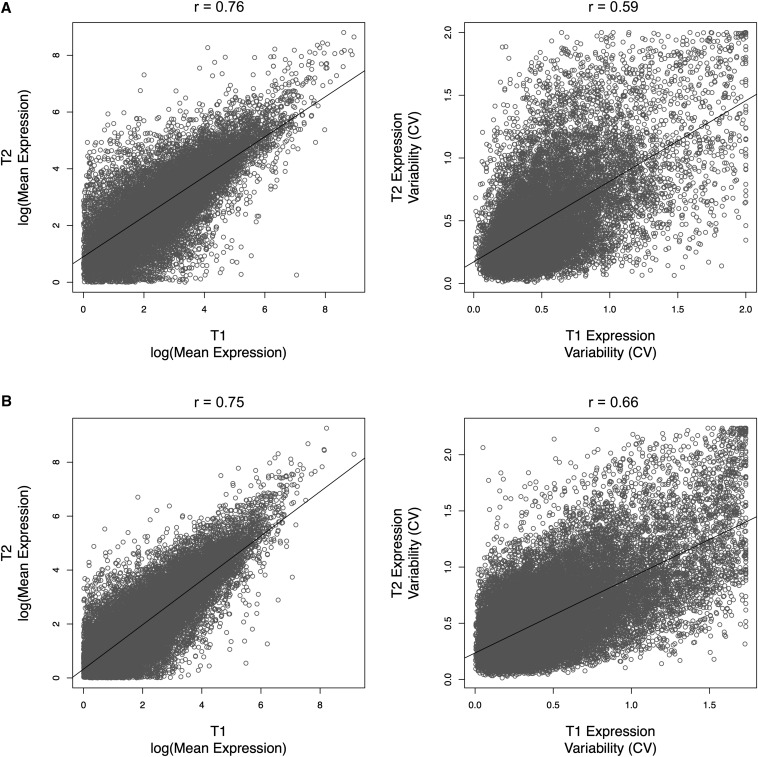
Figure 4.
Correlation in expression mean (FPKM) and variability (CV), as measured by RNA-seq, between the biological replicates (T1 and T2) of M. guttatus (A) and M. l. luteus (B). Values for Pearson’s correlation coefficient are given above each graph and the line of best fit is shown in black. Genes with mean expression <1 FPKM were excluded from the plot. CV, coefficient of variation; FPKM, fragments per kilobase per million reads; RNA-seq, RNA sequencing.

