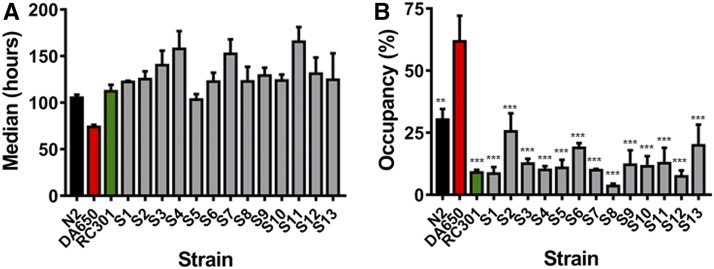
Figure 2.
Susceptibility to pathogen and avoidance phenotypes of the strains subjected to WGS. (A) Animals were exposed to P. aeruginosa under standard killing assay conditions, and scored for survival. The median, which was determined for each nematode strain exposed to P. aeruginosa, is shown. S1–S13 are progeny of the cross of the parental strains RC301 and DA650 that showed the phenotype of interest. The graph represents the combined results of at least two independent experiments; error bars indicate SEM, n = 60 adult animals/strain. (B) Animals that showed an enhanced resistance to pathogen infection in comparison to the parental strain DA650 were placed on a spot of P. aeruginosa under the same conditions used for the survival assays, and monitored at 36 hr for their presence or absence on the lawn. The graphs represent the combined results of three independent experiments; error bars indicate SEM, n = 60 adult animals/strain.

