Figure 3.
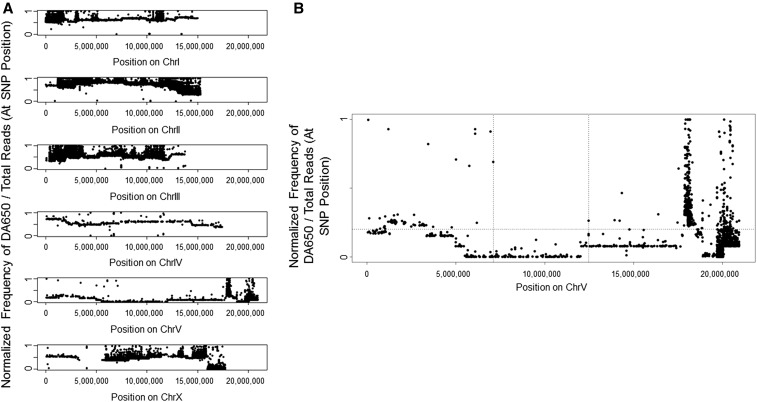
WGS-SNP data for all chromosomes. (A) The plot shows the normalized ratio of the DA650 allele/total reads at each mapped SNP position in the genome. The mapped SNP positions are those distinguishing the parental strains DA650 and RC301. (B) The plot shows the enlarged mapping region of chromosome V. The mapping region was defined by the physical location of the two consecutive mapping SNPs located furthest apart from one another using a frequency = 0.2 as filtering criteria (dotted horizontal line). Dotted vertical lines located at positions 7,098,350 and 12,463,435 delimit the mapping region.

