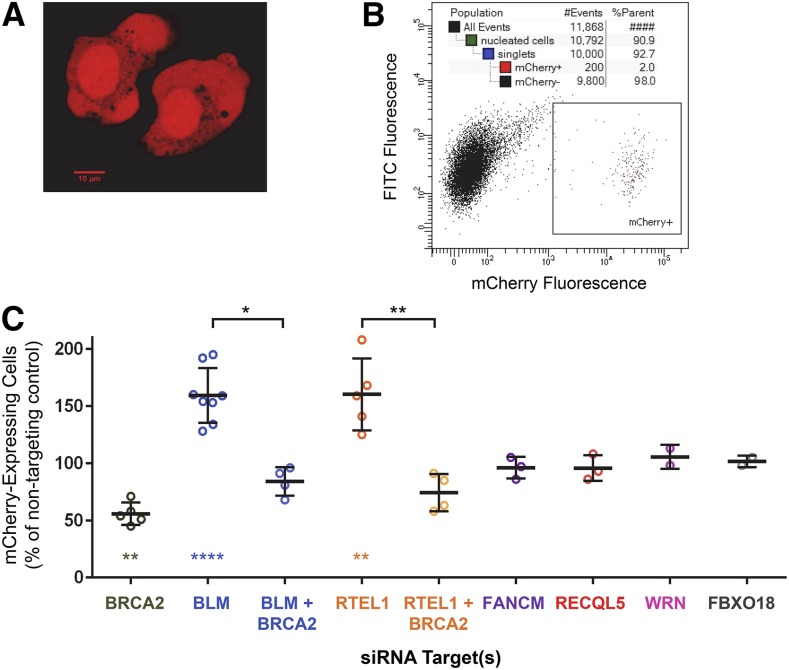
Figure 3.
Results from the SDSA assay. (A) Cells fluorescing red due to mCherry expression after I-SceI infection. (B) Flow cytometry of cells after I-SceI expression. In this example, 10,000 singlet cells were assayed and 200 were gated as exhibiting red fluorescence. (C) Effects of siRNA knockdown on acquisition of mCherry expression (see Materials and Methods). Fluorescence frequencies from flow cytometry were normalized to NT; raw data are given in Table S2 in File S1. Error bars indicate SD. The ratio paired t-test was used to compare raw values for each siRNA target to its NT control and each double-knockdown to the single knockdown of the corresponding helicase. For helicase single knockdowns, P values were Bonferroni-corrected for multiple (six) comparisons. * P < 0.05, ** P < 0.01, **** P < 0.0001.

