Figure 4.
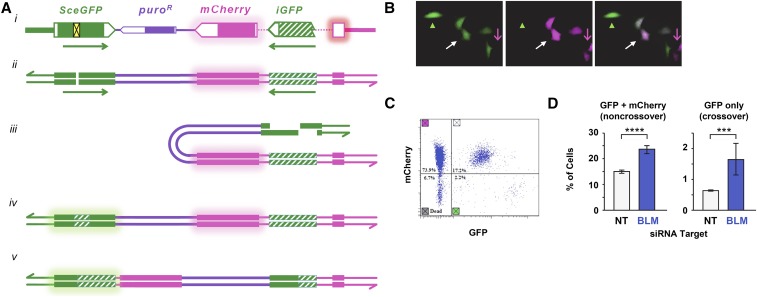
An assay to detect crossovers generated during DSB repair. (A) Schematic of the assay. The diagram at the top (i) has the SceGFP gene in solid green, with the yellow box indicating insertion of an I-SceI site. The modified iGFP fragment (with the entire 3′ end of the gene) is indicated in hatched green. The mCherry gene is shown in magenta, with the intron represented as a dotted line. (ii) Representation of the construct as double-stranded DNA. (iii) After DSB introduction and resection, resected ends can pair with the homologous iGFP template. The example here shows intrachromatid repair. (iv) Gene conversion without a crossover results in replacement of the I-SceI site with GFP sequences, generating a functional GFP gene. mCherry expression is unaffected. (v) If a crossover is generated, the central region is inverted and mCherry expression is lost. Repair with the sister chromatid (interchromatid repair) may also be possible. In that case, a crossover results in a dicentric chromatid and an acentric chromatid; these products will not be recovered, but noncrossover gene conversion will be recovered. (B) A field of cells after I-SceI expression, showing the green (left) and red (middle, magenta) channels, and a merged image (right). Green arrowhead marks a cell that gained GFP expression but lost mCherry expression (a crossover); white arrow indicates a cell that gained GFP expression and retained mCherry expression (noncrossover gene conversion); magenta arrow indicates a cell in which GFP was not converted. (C) Flow cytometry showing gating for GFP and mCherry fluorescence. (D) Increased noncrossover and crossover gene conversion after knocking down BLM. Bars indicate percentage of cells expressing GFP and mCherry (noncrossover gene conversion; upper right quadrant of flow cytometry output) or GFP only (crossovers; lower right quadrant). Error bars are SD based on three different wells per treatment. Raw data are in Table S3 in File S1. *** P = 0.0010, **** P < 0.0001 based on unpaired t-test.

