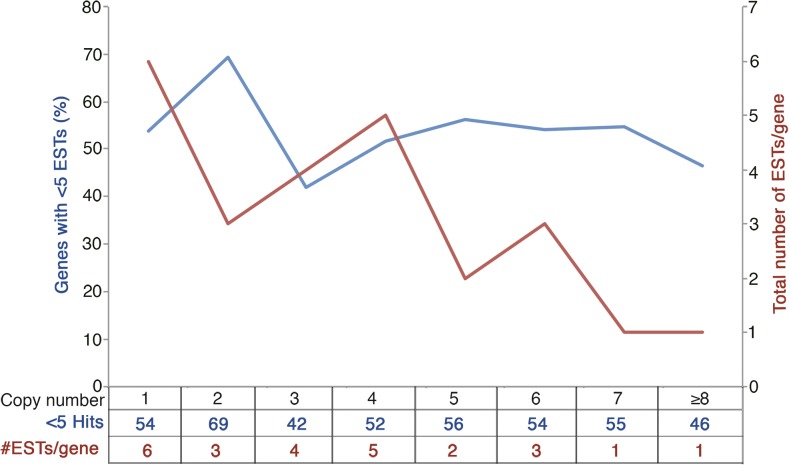
Figure 2.
Expression pattern of genes relative to structural copy number. The y1-axis (blue) shows percent of genes corresponding to each structural copy number class, showing low level of expression predicted based on the proportion of genes showing < 5 ESTs (expressed sequence tags) for a gene. The y2-axis (red) shows the number of ESTs for each of the gene copies.

