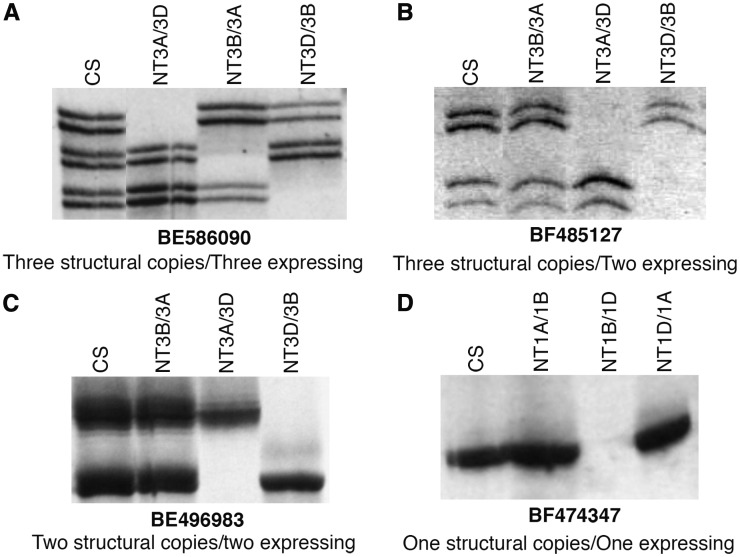
Figure 3.
Homeologous gene expression analysis by cDNA-SSCP analysis. NTA, NTB, and NTD indicates the NT lines for the corresponding A, B, and D genome chromosomes. The structural copy number given under each figure is from the physical mapping of the corresponding EST by gel-blot analysis. (A–D) Varying copy number with varying number expressing is shown. cDNA, complementary DNA; CS, Chinese spring; EST, expressed sequence tag; NT, nullisomic-tetrasomic; SSCP, single-stranded conformational polymorphism.

